Q2 of 2015 closed today (Tuesday, June 30). The following describes candle action, to date, in four timeframes — Yearly, Quarterly, Monthly and Weekly.
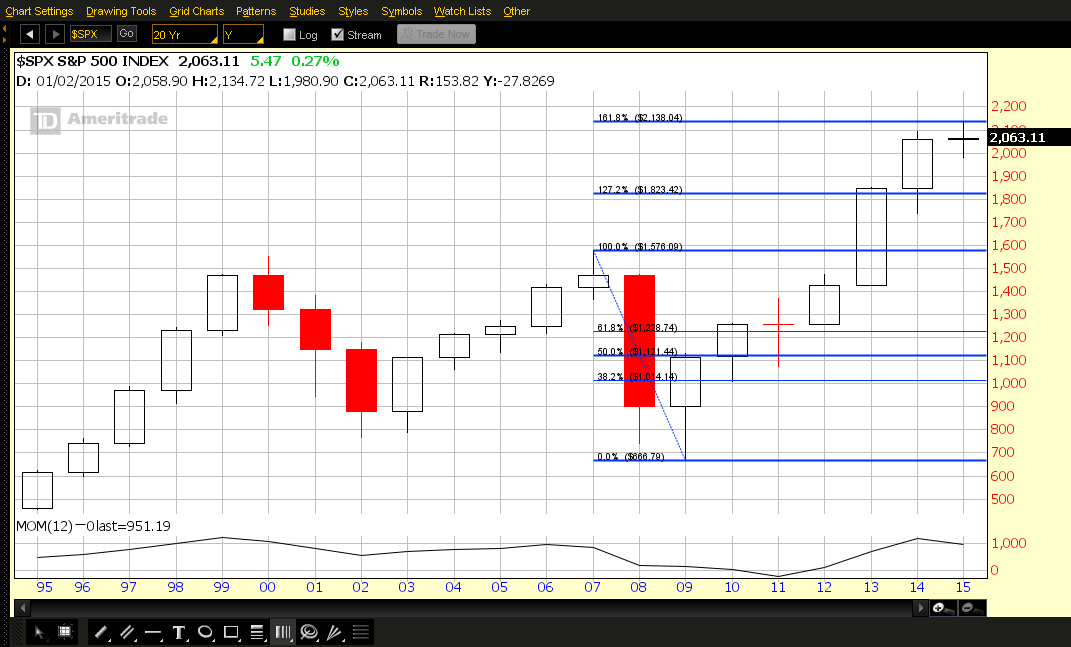
Each candle shown on the following chart of the SPX represents One Year.
The first half of this year is depicted by a “doji,” as of the close on June 30 — spelling “indecision” by this equity market. So far, the close is a mere 4.21 points higher than its open on January 2…not much of a gain in six months…no surprise, since price has been held back by the 161.8% External Fibonacci Retracement level (taken from the last major swing high in 2007 to the 2009 low), which is a typical major Fibonacci profit-taking level.
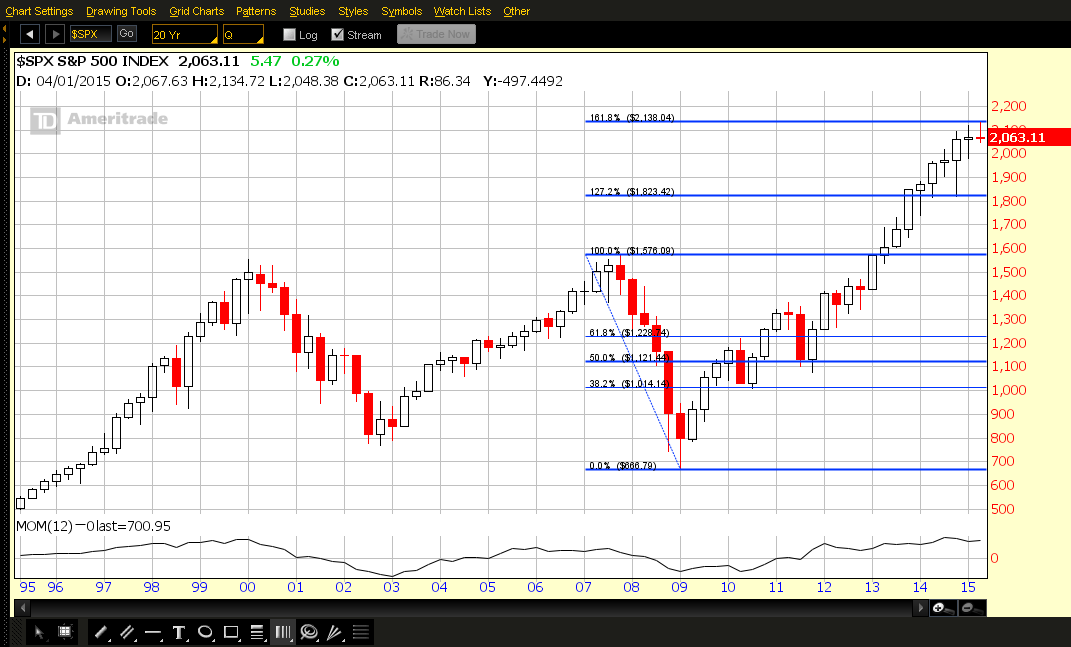
Each candle on this next chart of the SPX represents One Quarter of One Year.
Q1 of this year is depicted by a “spinning top” — spelling “indecision” by this equity market. Q2 of this year is depicted by a “shooting star” with a slightly lower close than Q1 — spelling a rejection of higher prices and a “bearish tilt” to this market.
FURTHER OBSERVATIONS
Momentum has declined since 2014 on both charts — confirming the lack of bullish confidence and commitment in this index. Candle action on both charts shows that major profit-taking has occurred in a considerable number of stocks in this index, so far, this year. In order to confirm that bears have taken firm control of this index going into Q4 of this year, we’ll need to see a lower close on the Q3 candle (which begins tomorrow) on September 30.
DRILLING DOWN
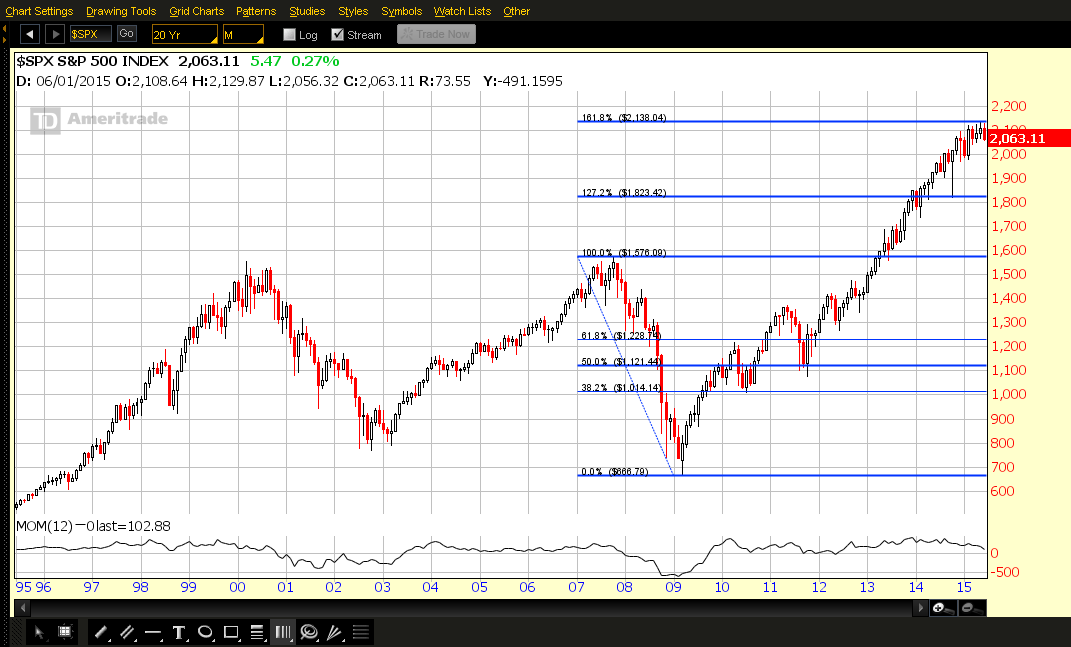
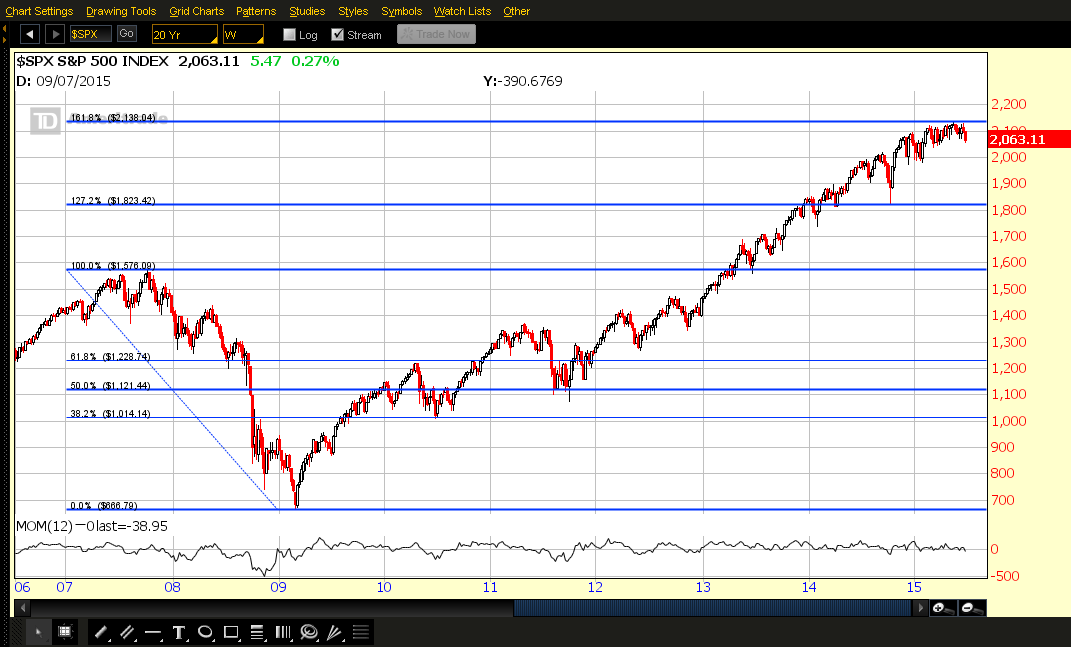
However, looking at two shorter time frames:
- because of June’s “bearish engulfing” candle, we’ll need to see a lower close for the upcoming July candle on the following Monthly chart to signal further medium-term bear strength going into August, and
- because of last week’s “bear harami” candle and a lower price below that close, so far, this week, we’ll need to see a lower close by the end of this week on the following Weekly chart to confirm further short-term bear strength going into next week.
So, I’d watch for lower lows on this week’s candle with a lower close on Friday, and, then, a lower low on July’s candle with a lower close on July 31 — also, a drop and hold of the Momentum indicator below the zero level on both charts (it has already dropped below zero on the Weekly timeframe) — to warn of bearish control of this index going into August.


