Last week my post concluded with commentary on small business growth - which I consider a major element of economic growth and middle class strength.
Follow up:
Living in developing countries most of my life, the role of small business is obvious in improving the lot of the middle class. What is happening today in the USA can be explained in a single graphic from Gallup:

It was pointed out to me that this graph did not align with the Bureau of Labor Statistics (BLS) private sector establishment births and deaths data which shows that this graph was not current - and that current data was showing a recovery. Could it have been that Gallup misrepresented the small business situation by cutting off the data early?
- The Gallup graph is based on US Census Business Dynamics Statistics which includes mom and pop (self employed) to Wal-Mart (the largest USA employer). The BLS establishment survey is based on PAYROLLS - which means that if you use the BLS data, one is not viewing the specific strata of the economy my post was highlighting (e.g. self employed).
- The most recent data from the US Census Business Dynamics Statistics cuts off at the end of 2012, and the Gallup graph looks like it included the most recent data (but who knows as this graph did not say specifically).
Yet, it was bothering me that some data was not aligning with the Gallup graphic. The US Census Business Dynamics Statistics was available in enough detail that one could draw their own conclusion without using the Gallup representation of the situation. I do not care about breaking down births and deaths of business. What I want to see is the total amount of businesses active correlated to population growth.

Even with the crater created by the Great Recession - the total number of businesses has correlated well over time with population growth. Yet, this data is ALL business, not small business and particularly Mom and Pop (self employed business) which my post last week was discussing. The data in the US Census Business Dynamics Statistics is detailed enough to break out the smallest business segment.

Although mom and pop business did not perform as well as total business - but the number of mom and pop business has pretty much correlated with population growth. Please note that business with 1 to 4 people represent 55% of all business and 5% of all jobs.
All I can say is that I am sorry that I used the Gallup graph in my post last week - as it misrepresented the source data of the US Census Business Dynamics Statistics series. There is no indication that small business needs special attention of politicians - which is contrary to one of my statements in last week's post.
Other Economic News this Week:
The Econintersect Economic Index for February 2015 continues to show a stable and growing economy - again with a modest decline in growth from last month. All portions of the economy outside our economic model - except residential housing - are showing reasonable expansion. The growth trend line for our model is decelerating, however, if we toss in a few more elements which we analyze (but do not include) in our economic forecast model (such as employment or consumer sentiment) - the trends are improving rather than slowing.
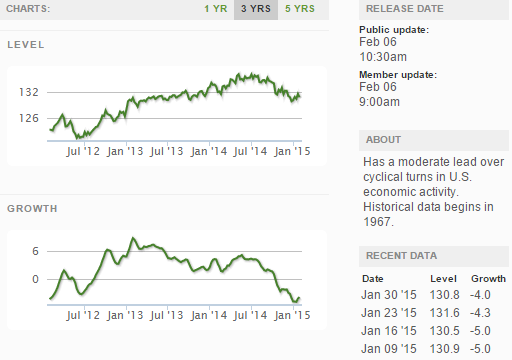
The ECRI WLI growth index value crossed slightly into negative territory which implies the economy will not have grown six months from today.
Current ECRI WLI Growth Index
The market was expecting the weekly initial unemployment claims at 280,000 to 310,000 (consensus 300,000) vs the 265,000 reported. The more important (because of the volatility in the weekly reported claims and seasonality errors in adjusting the data) 4 week moving average moved from 306,750 (reported last week as 306,500) to 298,500. The rolling averages have been equal to or under 300,000 for the 19 of the previous 20 weeks.
Weekly Initial Unemployment Claims - 4 Week Average - Seasonally Adjusted - 2011 (red line), 2012 (green line), 2013 (blue line), 2014 (orange line), 2015 (violet line)

Bankruptcies this Week: Endeavour Shipping Company (Limassol, Cyprus-based filed for Chapter 15), Cache, RadioShack
Click here to view the scorecard table below with active hyperlinks
Weekly Economic Release Scorecard:
