Today Silver Wheaton Corporation (TSX: SLW) (NYSE: SLW) declared its first quarterly cash dividend payment for 2013 of US $0.14 per common share. This dividend will be paid on April 2, 2013, and will be distributed on or about April 12, 2013.
This is good news for shareholders in that it is the highest quarterly dividend to date by SLW. Randy Smallwood, President and Chief Executive Officer of Silver Wheaton commented on the dividend payment as follows:
"2012 was another exceptional year for Silver Wheaton, anchored by a fourth quarter that saw record production, sales, revenue, net income, and cash flow for the company," "With the addition of production from Hudbay's 777 mine midway through the year, plus growing production from Peñasquito, San Dimas and Zinkgruvan, 2012 production exceeded our forecast by over one and a half million ounces."
"This translated into sales of over 27 million ounces, with the fourth quarter coming in at over nine million ounces, and full year cash flows of over $719 million. Given our dividend policy of paying out 20% of the trailing quarter's cash flow, Silver Wheaton's strong production growth profile directly translates into higher dividends, with $0.35per common share paid during 2012, almost double what was paid in 2011, and our strong fourth quarter resulted in our first dividend in 2013 being $0.14 per share."
Fourth Quarter highlights as follows:
We would draw your attention to the increase in cash costs which rose to $4.70 per silver equivalent ounce, compared to $4.06 per silver equivalent ounce in Q4 2011. With silver trading at $29.00/oz this increase is not a big deal, but should be watched especially with new acquisitions as they will tend to towards requiring a better return for their silver production.
• Record attributable silver equivalent production of 8.5 million ounces compared to 6.9 million ounces in Q4 2011 and 7.7 million ounces in Q3 2012, representing an increase of 22% and 10%, respectively.
• Record silver equivalent sales of 9.1 million ounces compared to 6.0 million ounces in Q4 2011 and 5.1 million ounces in Q3 2012, representing an increase of 53% and 78%, respectively.
• Record revenues of $287.2 million compared to $191.9 million in Q4 2011, representing a 50% increase.
• Record net earnings of $177.7 million ($0.50 per share) compared to $144.7 million ($0.41 per share) in Q4 2011, representing a 23% increase.
• Record operating cash flows of $254.0 million ($0.72 per share1) compared to $163.7 million ($0.46per share1) in Q4 2011, representing a 55% increase.
• Cash operating margin1 of $26.76 per silver equivalent ounce, compared to $28.06 in Q4 2011, representing a 5% decrease.
• Average cash costs1 rose to $4.70 per silver equivalent ounce, compared to $4.06 per silver equivalent ounce in Q4 2011, representing a 16% increase, driven primarily by higher costs associated with silver and gold from the Hudbay 777 mine ($5.90 and $400 per ounce of silver and gold, respectively).
• Declared quarterly dividend of $0.14 per common share, representing 20% of the cash generated by operating activities during the three months ended December 31, 2012.
Background to Silver Wheaton
Silver stream or silver purchase agreements allow Silver Wheaton to purchase, in exchange for an up-front payment, the by-product silver production of a mine that it does not own or operate. Since approximately 70% of all silver production occurs as a by-product of base or precious metals production, there are numerous potential opportunities for further growth with this business model.
Based upon its current agreements, forecast 2013 attributable production is approximately 33.5 million silver equivalent ounces, including 145 thousand ounces of gold. By 2017, annual attributable production is anticipated to increase significantly to approximately 53 million silver equivalent ounces, including 180 thousand ounces of gold. Other than its initial upfront payment, Silver Wheaton typically has no ongoing capital or exploration costs, and the company does not hedge its silver or gold production.
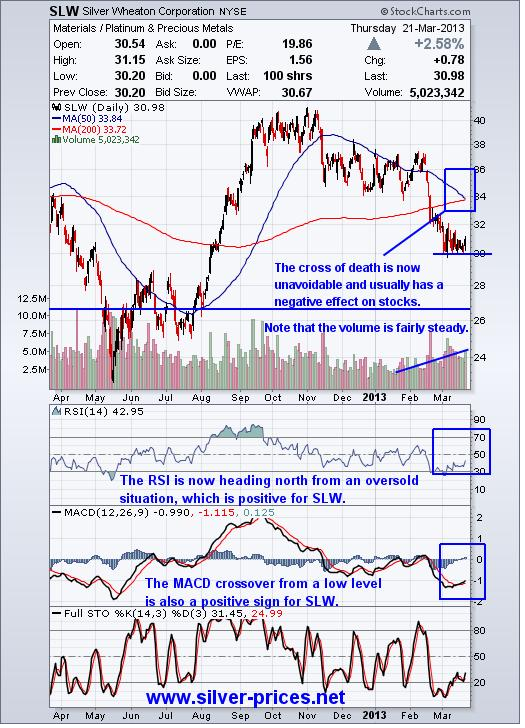
Taking a quick look at the chart we can see that there is some support at the $30.00 level, however, progress depends on the price of silver and with the summer doldrums upon us, progress could be a tad lackluster.
Analyst opinions
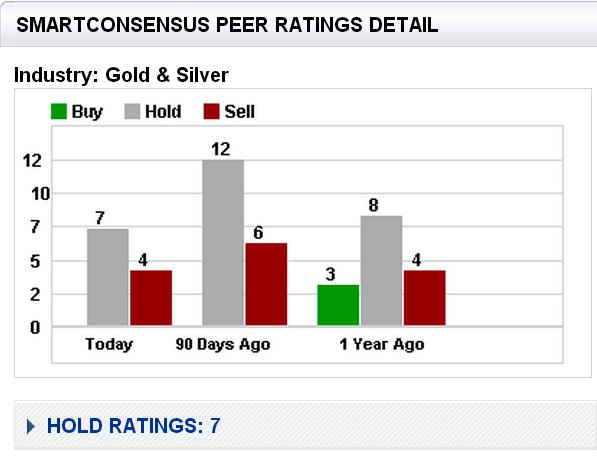
We can see from the above chart that none of these analysts are recommending this stock. For those who are contrarian by nature this could be an indication that the bottom has been reached and therefore a buying opportunity presents itself.
Trading Ideas
For a long idea in the precious metals space, we suggest accumulating this stock as and when you can. However the fortunes of SLW are predicated on the performance of silver prices heading to higher ground. In the short term we are entering into the summer season, which generally is a quiet time for both gold and silver, so this consolidation period may continue over the summer months. Patience may well be required.
Financials
Silver Wheaton Corporation has a market capitalization of $10.98B, an EPS of $1.55, a 52 week low of $22.94 and a high of $41.30, average volume of shares traded is around 4.00/5.00Mln, so the liquidity is good, with 354.29 million shares outstanding. Current stock price is $30.98.
Revenue was $287.2 million in the fourth quarter of 2012, on silver equivalent sales of 9.1 million ounces (7.3 million ounces of silver and 33,000 ounces of gold). This represents a 50% increase from the $191.9 million of revenue generated in the fourth quarter of 2011, due primarily to a comparable increase in the number of ounces sold with relatively unchanged gold and silver prices.
Silver Wheaton Corporation can be found on both the NYSE and the TSX under the symbol of SLW.
Finally, with the Eurozone still wrestling with the financial aspects of some of its member states, notably Cyprus and the creation of money out of thin air, we expect both gold and silver prices to finish the year much higher than they are now.
Disclosure: We do own this stock.
Disclaimer: www.gold-prices.biz or www.skoptionstrading.com makes no guarantee or warranty on the accuracy or completeness of the data provided. Nothing contained herein is intended or shall be deemed to be investment advice, implied or otherwise. This letter represents our views and replicates trades that we are making but nothing more than that. Always consult your registered adviser to assist you with your investments. We accept no liability for any loss arising from the use of the data contained on this letter. Options contain a high level of risk that may result in the loss of part or all invested capital and therefore are suitable for experienced and professional investors and traders only. Past performance is neither a guide nor guarantee of future success.
ORIGINAL POST
- English (UK)
- English (India)
- English (Canada)
- English (Australia)
- English (South Africa)
- English (Philippines)
- English (Nigeria)
- Deutsch
- Español (España)
- Español (México)
- Français
- Italiano
- Nederlands
- Português (Portugal)
- Polski
- Português (Brasil)
- Русский
- Türkçe
- العربية
- Ελληνικά
- Svenska
- Suomi
- עברית
- 日本語
- 한국어
- 简体中文
- 繁體中文
- Bahasa Indonesia
- Bahasa Melayu
- ไทย
- Tiếng Việt
- हिंदी
Silver Wheaton Corp To Pay Quarterly Dividend
Published 03/24/2013, 04:19 AM
Updated 07/09/2023, 06:31 AM
Silver Wheaton Corp To Pay Quarterly Dividend
Introduction
Latest comments
Loading next article…
Install Our App
Risk Disclosure: Trading in financial instruments and/or cryptocurrencies involves high risks including the risk of losing some, or all, of your investment amount, and may not be suitable for all investors. Prices of cryptocurrencies are extremely volatile and may be affected by external factors such as financial, regulatory or political events. Trading on margin increases the financial risks.
Before deciding to trade in financial instrument or cryptocurrencies you should be fully informed of the risks and costs associated with trading the financial markets, carefully consider your investment objectives, level of experience, and risk appetite, and seek professional advice where needed.
Fusion Media would like to remind you that the data contained in this website is not necessarily real-time nor accurate. The data and prices on the website are not necessarily provided by any market or exchange, but may be provided by market makers, and so prices may not be accurate and may differ from the actual price at any given market, meaning prices are indicative and not appropriate for trading purposes. Fusion Media and any provider of the data contained in this website will not accept liability for any loss or damage as a result of your trading, or your reliance on the information contained within this website.
It is prohibited to use, store, reproduce, display, modify, transmit or distribute the data contained in this website without the explicit prior written permission of Fusion Media and/or the data provider. All intellectual property rights are reserved by the providers and/or the exchange providing the data contained in this website.
Fusion Media may be compensated by the advertisers that appear on the website, based on your interaction with the advertisements or advertisers.
© 2007-2024 - Fusion Media Limited. All Rights Reserved.
