Get 40% Off
These stocks are up over 10% post earnings. Did you spot the buying opportunity? Our AI did.Read how

Shanghai Shuffle 'N Surge

Published 07/27/2014, 12:30 AM
Updated 07/09/2023, 06:31 AM

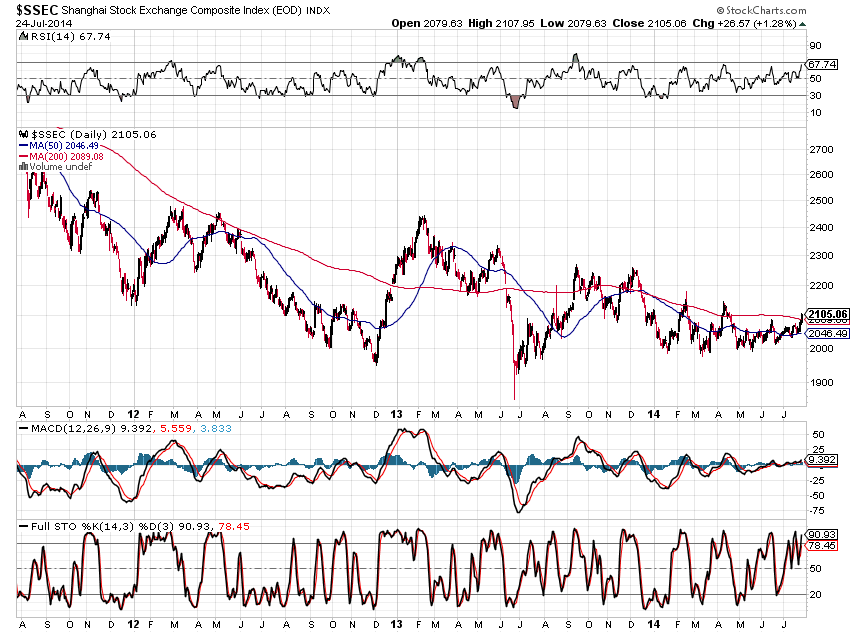
China's Shanghai Index has been quietly rallying since it approached the 2000 major support level once again in mid-June, as shown on the Daily chart of SSEC below. A recent surge has pushed price above the 200 MA, while the RSI, MACD, and Stochastics indicators remained above the zero levels and continued to rise.

Near-term support sits around 2090...a hold above this level should see price continue to rally.

Shanghai Composite Daily
 
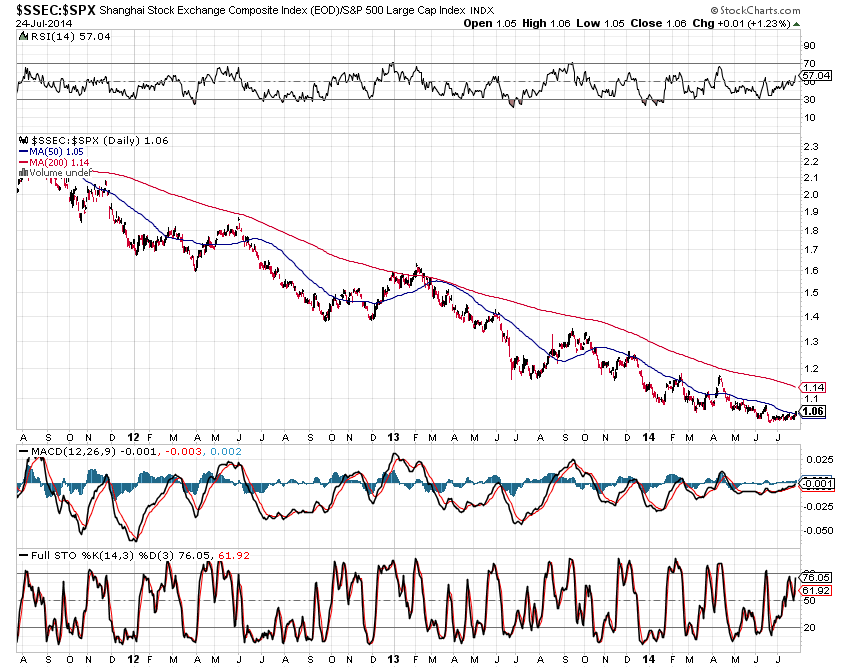
The following Daily ratio chart of SSEC:SPX shows a recent firming at 3-year lows and a minor push above the 50 MA (at 1.053), with rising RSI, MACD, and Stochastics above the zero level.
 
Near-term support sits around 1.050...a hold above this level should see price continue to strengthen against the SPX.
 
SSEC vs SPX Daily
 
The following Daily ratio chart of SSEC:EEM shows a recent firming at 3-year lows below the 50 MA, while the RSI, MACD, and Stochastics remain below the zero level.
 
Near-term resistance sits around 47.50...a break and hold above this level should see price continue to strengthen against iShares MSCI Emerging Markets (ARCA:EEM). However, it has yet to signal that it will outperform the EEM, even though it's giving the impression that it may.
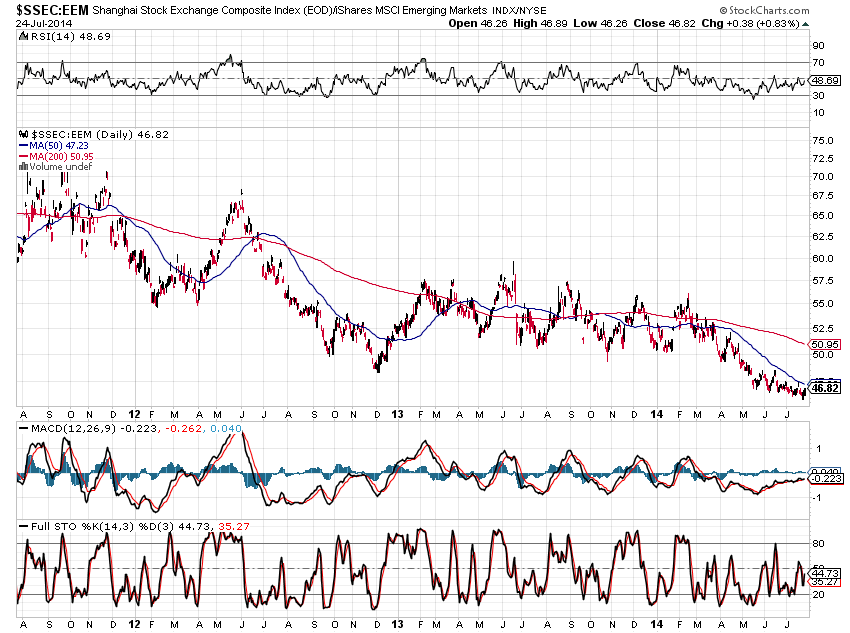
 
SSEC vs EEM Daily
 
We'll see whether traders continue to hold their long positions in the SSEC for any sustained length of time or whether this was simply a short-term technical trading opportunity off a triple-bottom formation in May. Monitoring the two ratio charts above, along with their indicators, should help to clarify any continued serious strength in this index.
3rd party Ad. Not an offer or recommendation by Investing.com. See disclosure here or remove ads .

Latest comments

Risk Disclosure: Trading in financial instruments and/or cryptocurrencies involves high risks including the risk of losing some, or all, of your investment amount, and may not be suitable for all investors. Prices of cryptocurrencies are extremely volatile and may be affected by external factors such as financial, regulatory or political events. Trading on margin increases the financial risks.
Before deciding to trade in financial instrument or cryptocurrencies you should be fully informed of the risks and costs associated with trading the financial markets, carefully consider your investment objectives, level of experience, and risk appetite, and seek professional advice where needed.
Fusion Media would like to remind you that the data contained in this website is not necessarily real-time nor accurate. The data and prices on the website are not necessarily provided by any market or exchange, but may be provided by market makers, and so prices may not be accurate and may differ from the actual price at any given market, meaning prices are indicative and not appropriate for trading purposes. Fusion Media and any provider of the data contained in this website will not accept liability for any loss or damage as a result of your trading, or your reliance on the information contained within this website.
It is prohibited to use, store, reproduce, display, modify, transmit or distribute the data contained in this website without the explicit prior written permission of Fusion Media and/or the data provider. All intellectual property rights are reserved by the providers and/or the exchange providing the data contained in this website.
Fusion Media may be compensated by the advertisers that appear on the website, based on your interaction with the advertisements or advertisers.
© 2007-2024 - Fusion Media Limited. All Rights Reserved.