
Summary- The energy and industrial ETFs outperformed this week.
- Over the longer term, conservative/defensive sectors are still outperforming the SPYs.
- I take a deeper look at the energy and industrial ETFs/sectors.
Let's start with the weekly performance table:

The energy sector (XLE) was the top performing sector followed by industrials. It's been a long time since I wrote that in an ETF review - both have been distinctly middling performers for some time. And technology and consumer discretionary at the bottom of the pack? That's almost unheard of in the current market.
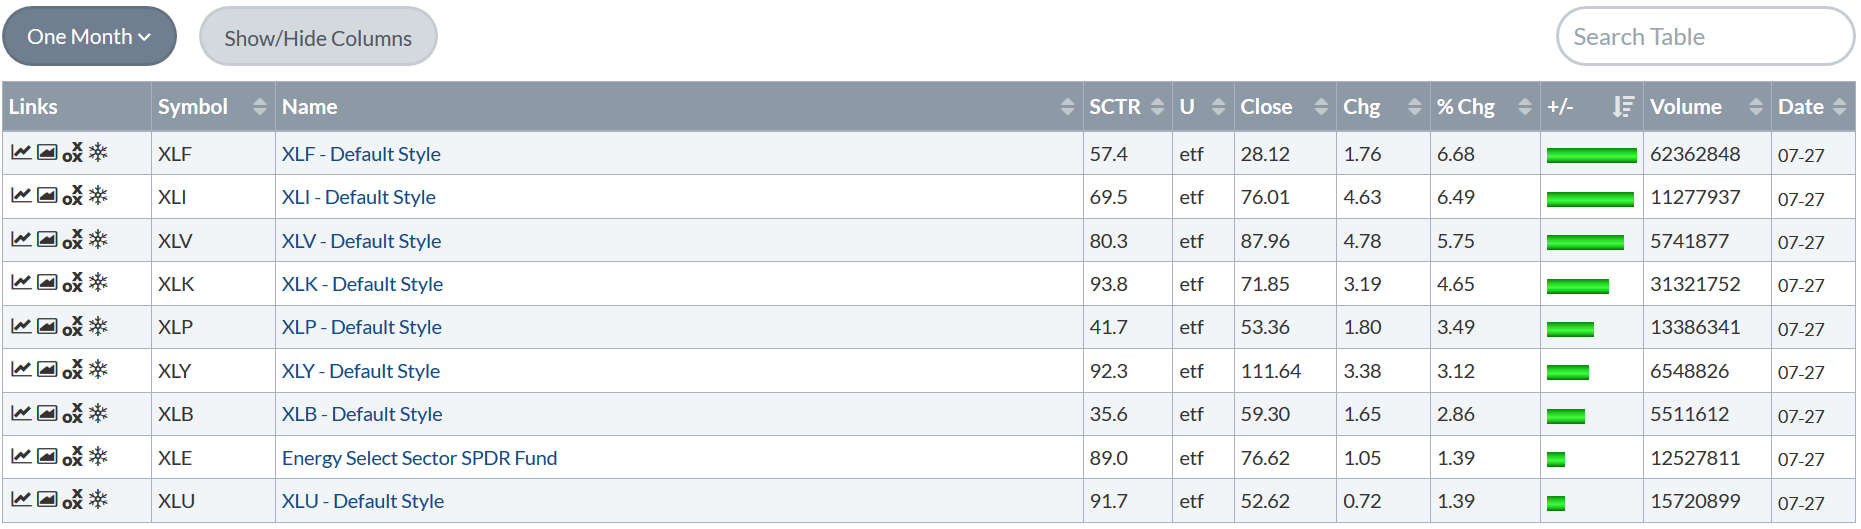
Looking at the one-month table, we again see odd combinations for the current rally. Financials) should be distinct underperformers right now due to the tightening interest rate spread. But thanks to strong earnings, it's the best performing sector over the last month. Industrials also advanced on news that the EU and the US had reached an "agreement to agree" on tariffs. Utilities were at the bottom of the list, thanks to the continued belief that the Fed will continue to raise rates (which it will).
Next, let's look at the relative strength of the sectors relative to the SPY over a 12-week period:

This is a far more revealing chart. Although the energy sector was the best performing sector this week, it is weakening versus the SPY over the longer run. Three sectors are currently outperforming: tech (which may drop to weakening soon based on this week's large declines in Facebook (NASDAQ:FB) and Netflix (NASDAQ:NFLX), consumer discretionary, and utilities. Two sectors are "improving:" staples and health care - both of which are defensive. Basic materials, industrials, and financials are still lagging.
Now, let's turn to some industrial specific detail, starting with the energy sector.

Yes, this sector outperformed the SPYs this week. But the chart is weak overall. The XLE has traded between the lower and upper 70s for the last two months. It has continually hit resistance in the upper 70s, where the ETF peaked in mid-January and mid-May.
A look at only the EMAs is more revealing:

The two shortest EMAs (the 10- and 20-day EMA) are moving sideways. The longer-term trends (as seen in the 50- and 200-day EMA) are moving higher, however. But then we have the MACD, which shows that right now momentum is stalled.
The reason is oil prices are very volatile right now:

Oil was in a solid uptrend, with prices using the trendline that connected the late August and early April lows. Prices first broke that trend in early June and again in mid-July. Like the XLE ETF, a look at oil's EMAs reveals important data:

All of the shorter EMAs are moving lower. Because of the extreme volatility of oil prices, that statement is less significant than if it were made regarding an ETF. But it's still important.
Finally, consider the charts of the XLE members:

There are a few charts that are in uptrends. But more importantly, two charts had quick pops this week due to strong earnings. This is most likely responsible for most of the XLE's outperformance this week.
Next, let's look at the XLIs, starting with the daily chart of the ETF:

This has the same problem as the XLEs: prices have been in a trading range for the last few months. But there are important differences, beginning with a more positive momentum picture: the MACD is rising and has plenty of room to increase. The shorter EMAs are above the 200-day EMA; all are rising. Combine those factors with the potentially bullish macroeconomic backdrop of the EU and US "agreeing to agree" on tariffs, and it's possible we could see additional increases.
Let's look at the short-term charts of the 10 largest members:

There are a number of charts that printed strong bars on Wednesday, which was caused by the EU/US news. But there are also some charts that have gaps higher which are indicative of positive earnings news. Of all 10, only two (CAT and GE) have bearish charts.
Let's turn to the year-long charts:

There are only two very bearish charts: GE and 3M Company (NYSE:MMM). Four issues - Boeing (NYSE:BA), United Technologies (NYSE:UTX), CSX (NASDAQ:CSX), and Union Pacific (NYSE:UNP) - are near yearly highs. Honeywell (NYSE:HON) had a big earnings-related pop, as did Lockheed Martin (NYSE:LMT) and United Parcel Service (NYSE:UPS). Overall there's a lot more to like in this sector. And considering the economic winds, we could see additional gains.
Disclosure: I/we have no positions in any stocks mentioned, and no plans to initiate any positions within the next 72 hours.
I wrote this article myself, and it expresses my own opinions. I am not receiving compensation for it (other than from Seeking Alpha). I have no business relationship with any company whose stock is mentioned in this article.