
Summary
Thanks to strong earnings, the financial sector was this week's big winner.
Over the 1-month and 3-month time frames, however, defensive sectors are making headway.
I take a deeper look at the financial and industrial sector.
Let's start - as we always do - with a look at the weekly sector performance.

Financials - which have underperformed due to rising interest rates - were the clear winner this week, rising 2.15%. Industrias rebounded, increasing a little under 1%. Then performance tapers off staples, and tech did move higher, but barely. After that, we see losses.
The monthly performance chart is very different:

Once again we see defensive sectors leading the way, with utilities, staples, and staples topping the performance table.
And we're starting to see stronger defensive sector performance over longer-term time horizons:

On a 3-month basis, technology and consumer discretionary are still leading the pack. But health care, staples, and utilities take up the 3, 4, and 5 spots on the list. This naturally leads to a discussion of the relative performance of the ETFs relative to the SPY:
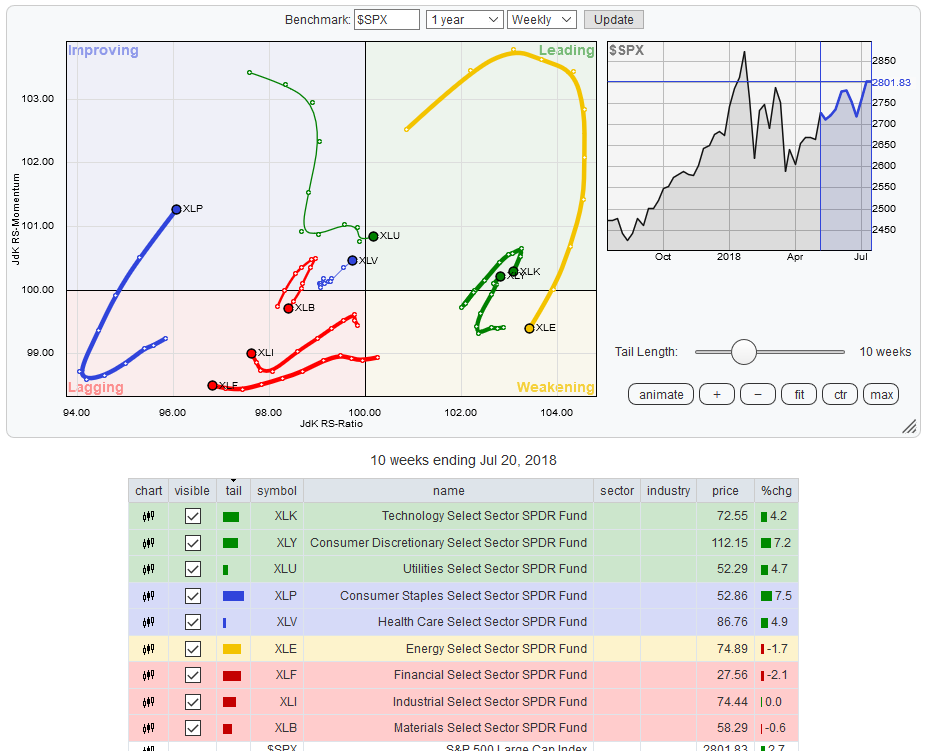
Tech and discretionary are still outperforming. But utilities joined the "outperforming" group this week. And consumer staples and healthcare are still "improving." Put another way, sectors are following the standard, late-cycle performance pattern.
Let's drill down into the data and look at some of this week's movers, starting with the financial sector. Of all the possible sectors to outperform in a rising rate environment, financials would be the last, right? But not when you've got a hot earnings hand:
Most banks that reported second-quarter 2018 results this week managed to record bottom-line improvement on the back of rising rates, lower provisions and improved trading activities. This also led to positive price movement for most bank stocks over the last five trading days. In addition to the benefits from higher interest rates, banks' results mirrored a marginal upswing in loans. Moreover, the results display eased margin pressure. Importantly, unexpected improvement in trading activities, mainly spurred by escalating trade war tensions between the United States and China, boosted trading revenues. Further, continued momentum in investment banking business was recorded, highlighting higher equity underwriting revenues and increased financial advisory revenues.
Despite the strong week, however, the XLF isn't in the greatest technical position:

Prices are consolidating sideways, trading between 26.5 and 28.5. They are using the 200-day EMA for technical support, which is a bullish development. But the fact they aren't making any new highs indicates that over the longer-term, Wall Street isn't impressed. The reason is that margins will eventually get squeezed:

The chart above plots the net interest margin for all US banks based on asset size. Only the largest banks (an incredibly small subset of the population) are seeing an increase.
And the overall picture of the 10 largest XLF holdings is very weak technically:

With the exception of American Express (NYSE:AXP) (top row, upper left), all the charts are either moving lower, are at/near 52-week lows, or are consolidating sideways.
Finally, let's take a look at the industrial sector. Fundamentally, this sector has a big problem: it stands right in the way of the US's trade war; should the trade war continue, it will take an earnings hit. The sector's chart shows that traders are well aware of that fact:

The daily chart closely resembles the health care sector; prices are gravitating above the 200-day EMA, which is a net positive. But they can't move more than 5-6% above that line without feeling its gravity.
The individual charts are somewhat better than those of their XLV counterparts:

There are a few strong charts above. Both railroads (Union Pacific Corporation (NYSE:UNP) and CSX Corporation (NASDAQ:CSX)) are in strong uptrends. Boeing (NYSE:BA) has a bid, thanks to an increase in defense spending. But there's also a fair amount of weakness. General Electric Company (NYSE:GE) is near its 52-week low as is 3M Company (NYSE:MMM). United Parcel Service Inc (NYSE:UPS) is struggling to find upward momentum, as is Lockheed Martin (NYSE:LMT). This is very much a mixed bag.
Despite this week's winners, the overall trend of defensive consolidation continues.
Disclosure: I/we have no positions in any stocks mentioned, and no plans to initiate any positions within the next 72 hours.
I wrote this article myself, and it expresses my own opinions. I am not receiving compensation for it (other than from Seeking Alpha). I have no business relationship with any company whose stock is mentioned in this article.