February 4-8 Week In Review
Summary
- The sector performance has moved from a solidly defensive (where defensive sectors are outperforming) to mixed orientation.
- The defensive sectors are falling out of favor relative to the SPYs.
- I take a deeper look at the tech and industrial ETFs.
Let's start where we always do: performance tables, beginning with the weekly results:
There isn't a solid bullish/bearish alignment in this week's table. Utilities (defensive) were the leader, but they were followed by tech and industrials (bullish). The bottom three sectors are more bullish. Energy was the worst performer, thanks to a decline in oil prices.
The monthly performance table suffers from the same problem: bearish sectors (XLU, XLP, and XLV) are right in the middle, surrounded by bullish industries. On the plus side, all the sectors are up; the only difference is the degree of each respective rally.
Finally, the three-month table is also mixed, with bullish and bearish sectors inter-mixed. The bottom four sectors are decidedly bearish, but the top four slots are equally weighted between aggressive and defensive industries.
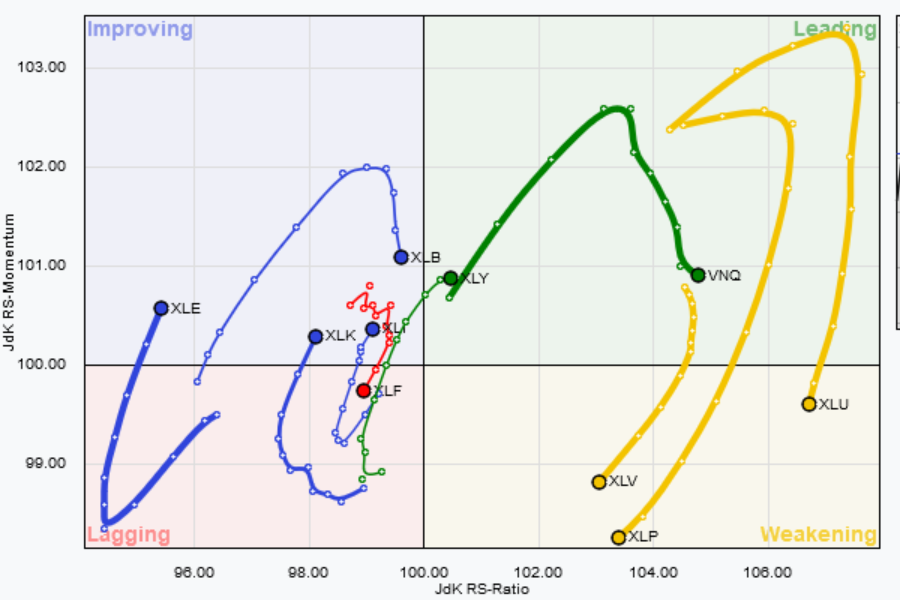
Let's take a look at the relative strength data:
Defensive sectors are weakening. Real estate is moving lower. Industrials, technology, and energy are improving. Basic materials are in the improving sector, but it's moving lower at a sharp rate. If it stays on its current trajectory, it'll make a sharp move through the leading sector before weakening.
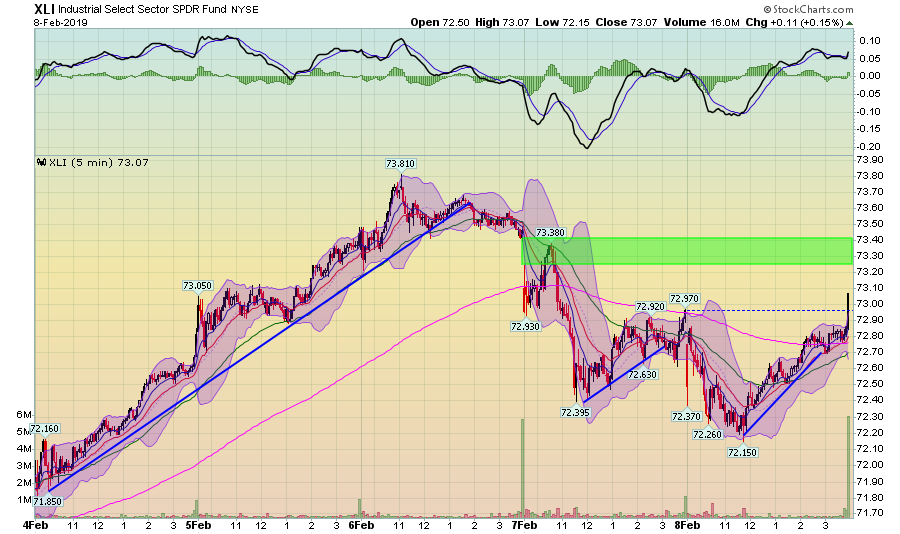
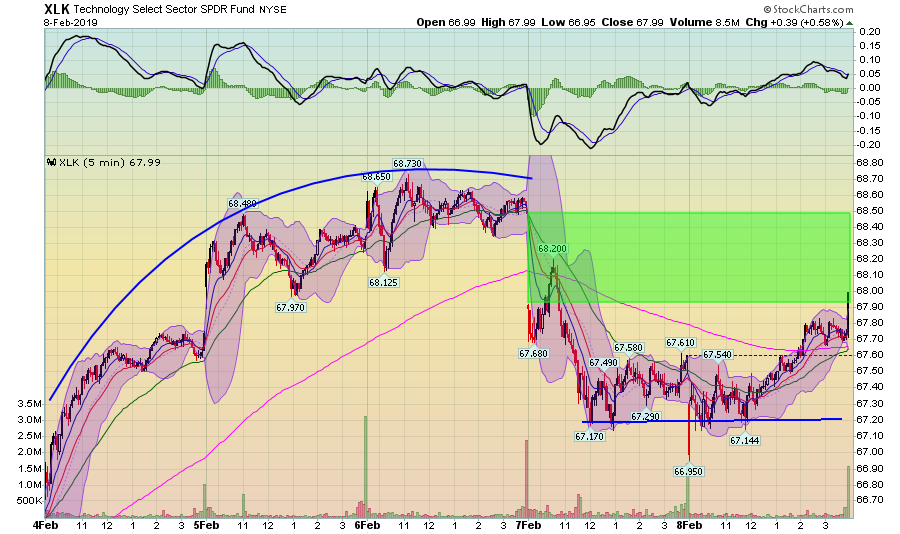
Let's take a deeper dive into the industrial and tech charts, starting with the last week's performance:
XLI moved higher for the first half of the week, gaining about 2 points. It consolidated gains on Wednesday afternoon and then gapped lower with the rest of the market on Thursday AM. The sector caught a bid with the broader market on Thursday and Friday, ultimately ending the week higher. XLI rallied for most of the session on Friday.
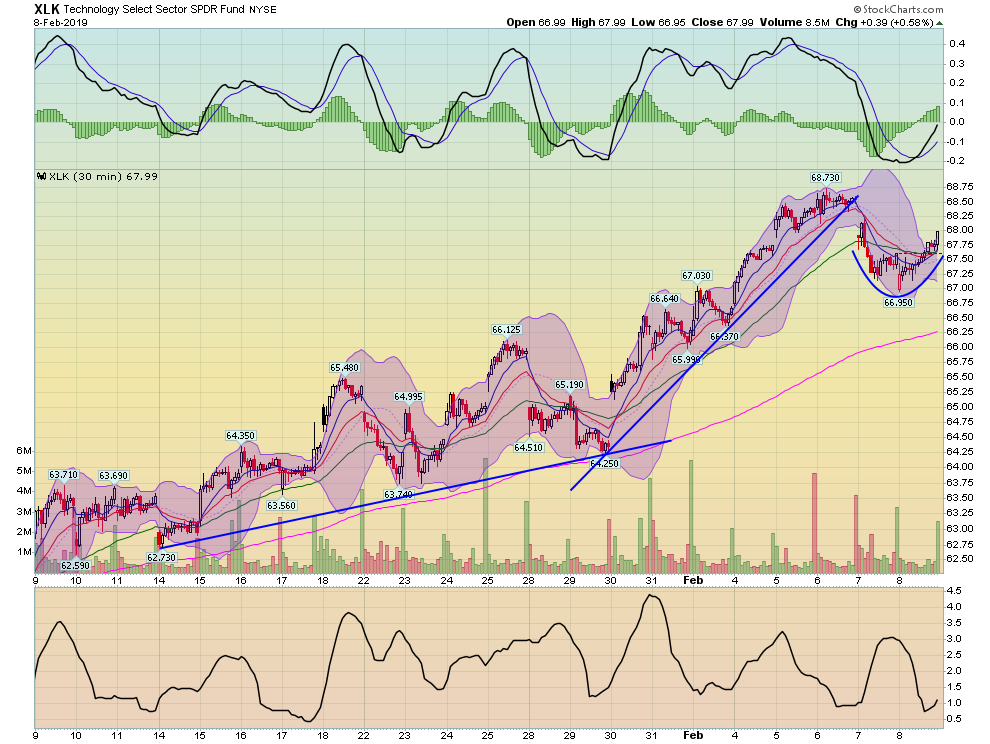
XLK's path was more parabolic during the first half of the week. After moving lower with the rest of the market on Thursday, the ETF found support in the lower 67 range before moving higher. Also, notice that that XLK was noticeably higher on Friday; it rallied most of the day.
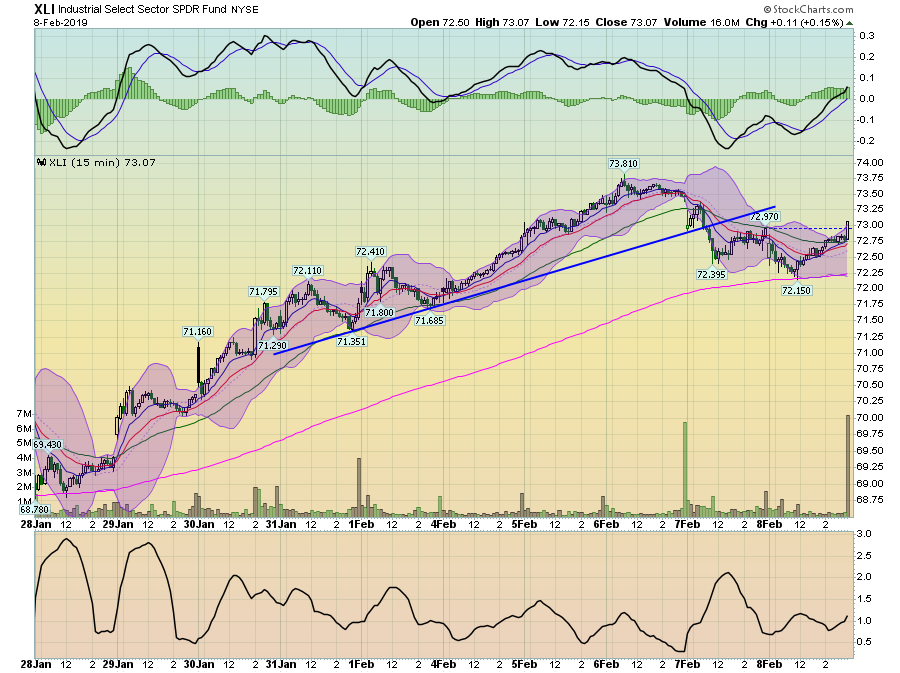
On the two-week chart, XLI has sold-off but fell to the 200-minute EMA - a natural level of support. And the overall drop on Thursday wasn't that large, relatively speaking. Finally, momentum gave a buy signal and has plenty of room to move higher.
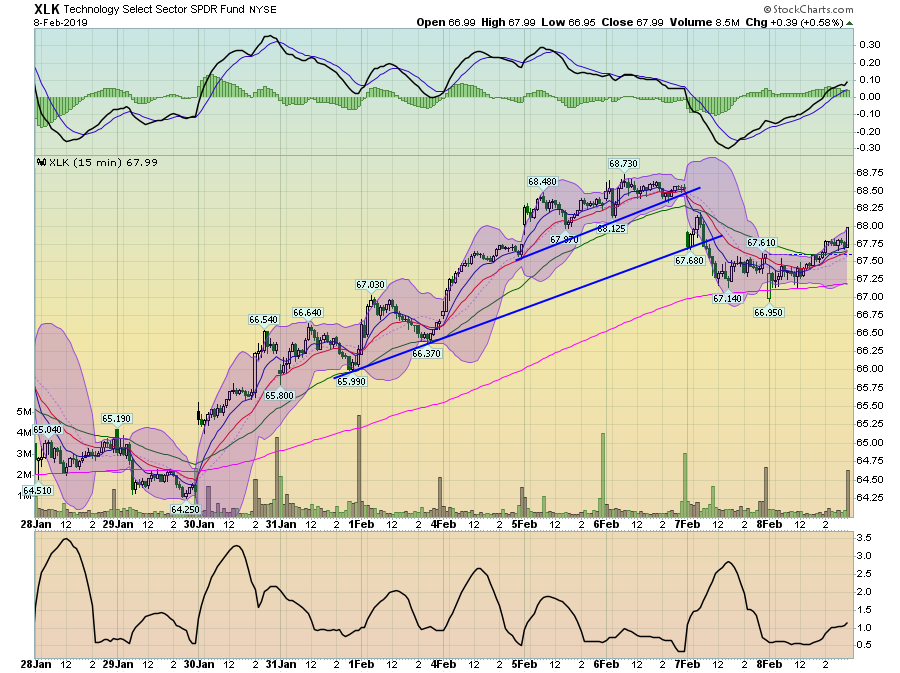
There are two uptrends on XLK's two-week chart. Neither is satisfactory from a technician's perspective. Like XLI, prices fell to the 200-minute EMA on Thursday and rallied higher. Momentum is rising as well.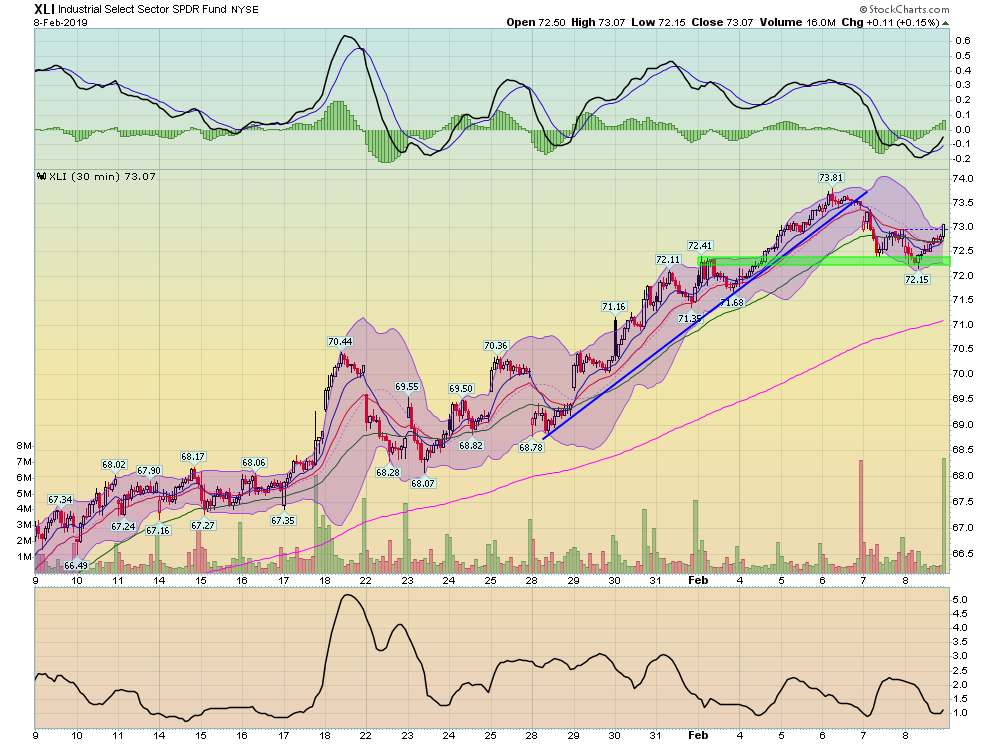
XLI moved sideways for the week of 9-17 and then started a strong and consistent move higher. The sell-off at the end of this week fell to the 72.5 level, where the ETF has support from a week ago. Momentum is positive as well.
There are two uptrends on XLK; one moderate move higher from mid-late January and a sharper move higher that carried the industry into February. On a longer time frame chart, last week's sell-off looks more like a rounding bottom.
Finally, let's look at the daily charts of each:
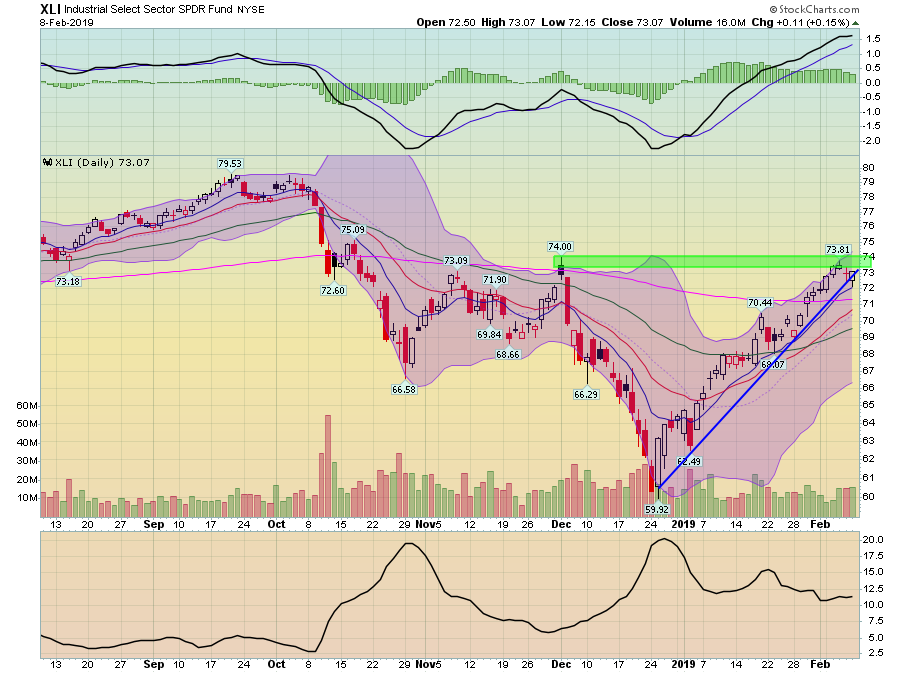
XLI hit resistance at the 74 levels and has fallen back to its upward trend line. All the EMAs are moving higher and momentum is rising.
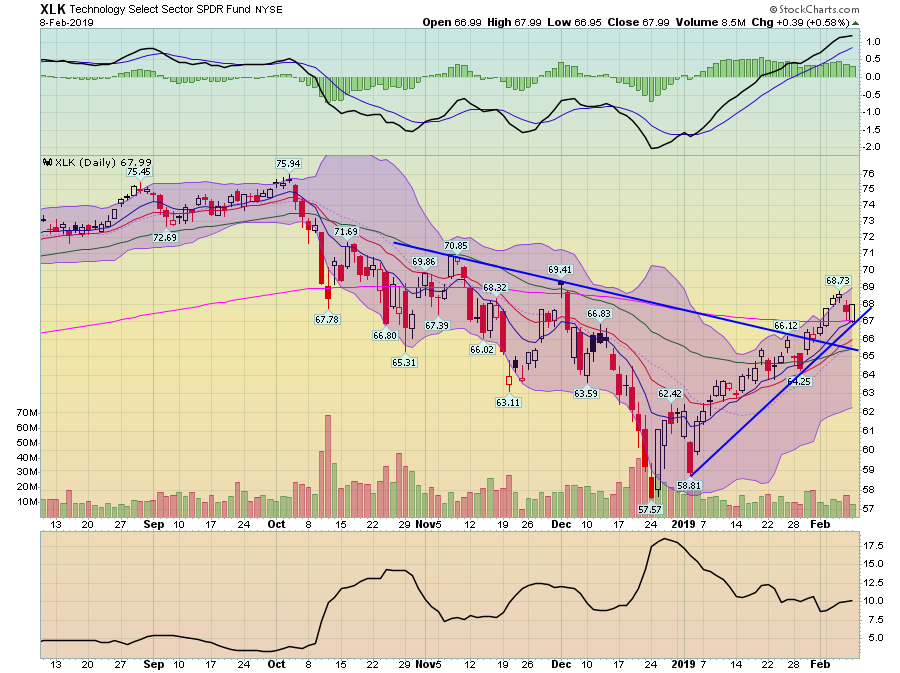
XLK is also in a clear upward trend. It has moved through the 200-day EMA and has fallen back to that level to test support. All the shorter EMAs are moving higher, as is the MACD.
Let's take a look at the performance of the 10 largest stocks in each sector, starting with XLI:
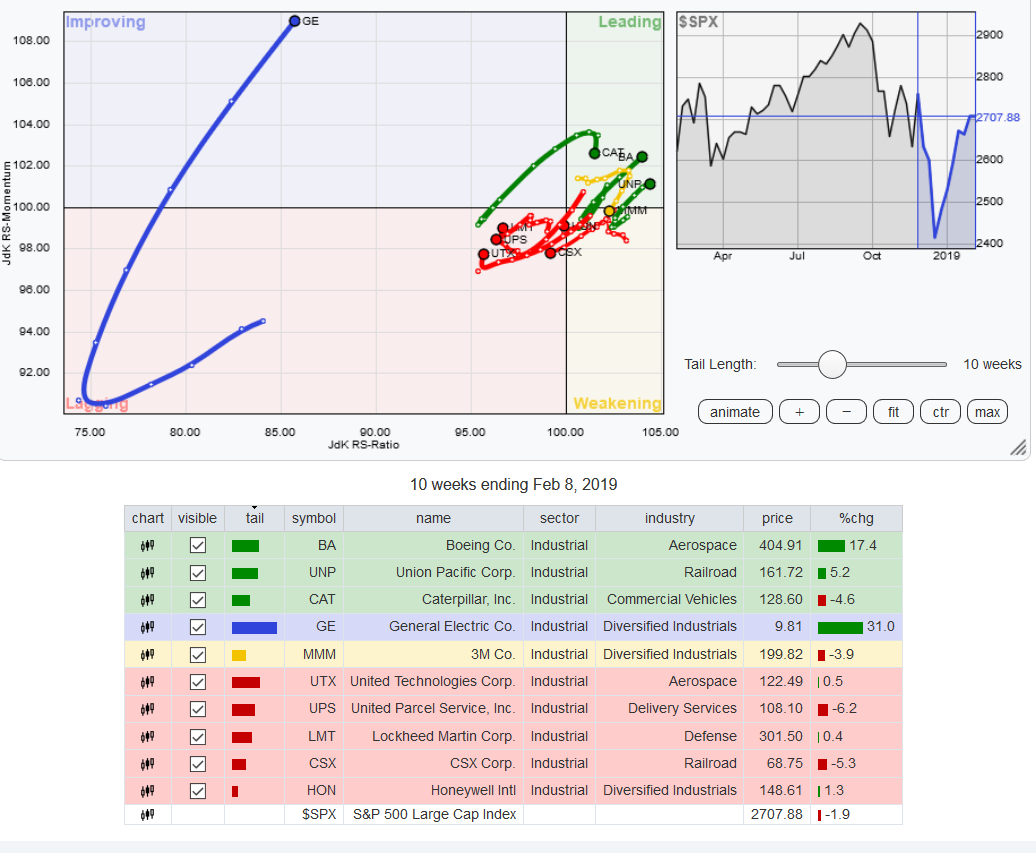
NYSE:GE's performance has thrown the RRG chart into a bit of chaos, so I've included the table at the bottom. The five companies that are lagging are all moving strongly into the lagging category. Union Pacific (NYSE:UNP) and Boeing (NYSE:BA) are making strong moves into the "outperformance" sector.
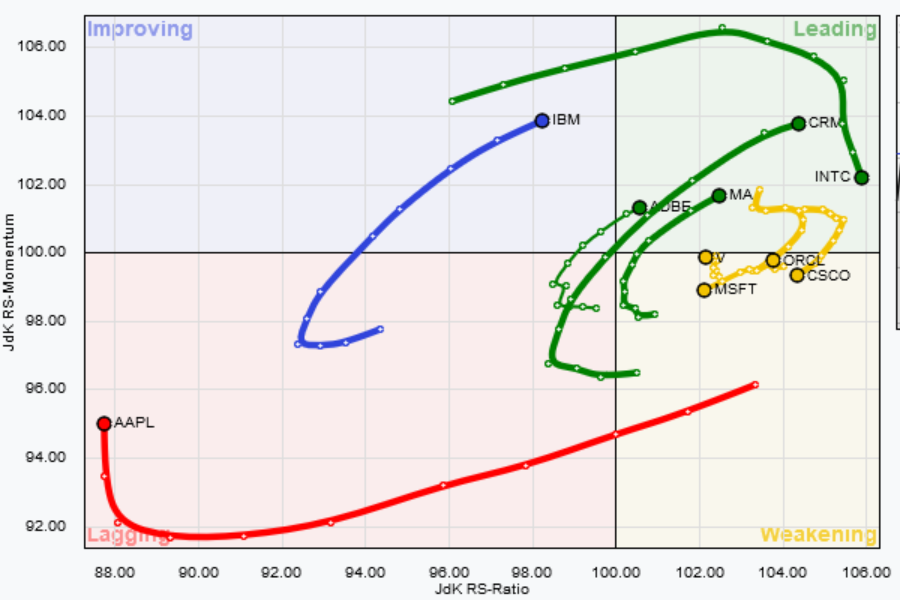
This is a really interesting table. First, ADBE, Mastercard (NYSE:MA), and Salesforce.com Inc (NYSE:CRM) are all making strong moves in the outperforming sector. Second, Visa (NYSE:V) and Oracle (NYSE:ORCL) are making quick U-turns into the leading sector as well. Finally, everyone's perennial favorite Apple (NASDAQ:AAPL) is making a long swing around the table; it's now moving up through the lagging sector and, assuming it maintains its current trajectory, will be improving within 6-8 weeks.
Both the tech and industrial sectors look interesting at this point. There are two ways to play this. The first is to simply add the ETFs - XLK or XLI. Or, you can add the stocks that are gaining strength relative to the SPYs. Either has the potential. But, as always, do your research and make sure the investment aligns with your risk tolerance.
Disclosure: I/we have no positions in any stocks mentioned, and no plans to initiate any positions within the next 72 hours. I wrote this article myself, and it expresses my own opinions. I am not receiving compensation for it (other than from Seeking Alpha). I have no business relationship with any company whose stock is mentioned in this article.


