The Canadian S&P/TSX Composite index is entering another reporting season with 41 companies reporting earnings in the week ending July 27, 2012. 50 companies representing approximately 32% of S&P/TSX Composite market capitalization have yet to report in July followed by another 174 index constituents in August and 11 in September.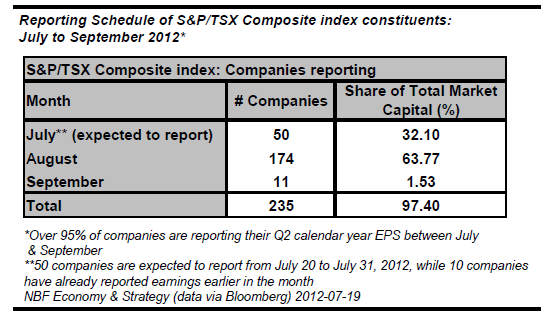
Earnings expectations
The S&P/TSX Composite index estimate of net income for the Q2 2012 calendar quarter is $27,260M which represents a growth rate of -14.0% (Qt/Qt-4). The estimate for the Q3 2012 calendar quarter is $28,876M, suggesting an annual growth of -0.9% (Qt/Qt-4).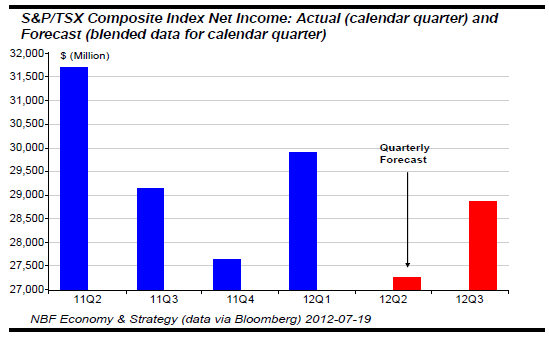
Net income represents operating earnings excluding extraordinary items. All data is representative for current index members and only for those where comparable historical data and estimates are available.
Earnings expectations by sector (GICS Level 1)
From a sector perspective Health Care (28.5%) and Industrials (11.5%) are expected to record the largest growth in net income for the Q2 2012 calendar quarter. The Information Technology (-92.1%) and Energy (-24.7%) sectors are expected to show the weakest growth over the respective period. Four of 10 sectors are expected to record an increase in net income when compared to net income reported for a comparable period one-year earlier.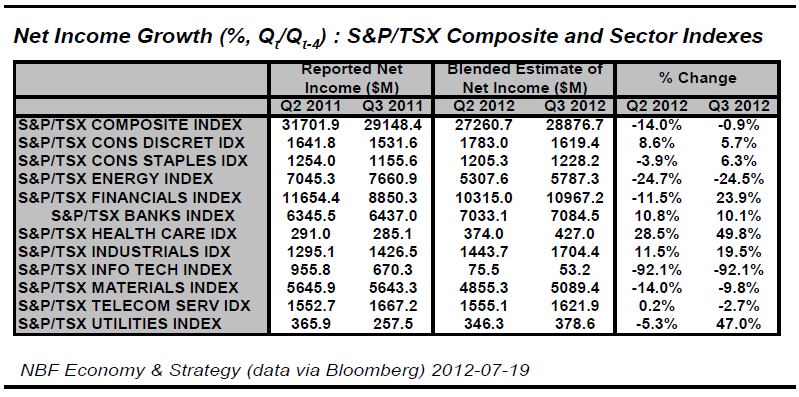
Sales/Revenue expectations
The S&P/TSX Composite index estimate of sales/revenue for the Q2 2012 calendar quarter is $258,642M which represents a growth rate of 1.8% (Qt/Qt-4). The estimate for the Q3 2012 calendar quarter is $267,574M, suggesting an annual growth of -4.8% (Qt/Qt-4).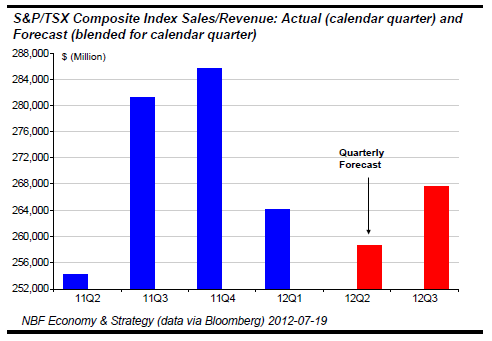
Sales/Revenue expectations by sector (GICS Level 1)
From a sector perspective Health Care (35.9%) and Industrials (10.4%) are expected to record the largest growth in sales/revenue for the Q2 2012 calendar quarter. The Information Technology (-25.9%) and Energy (-1.6%) sectors are expected to show the weakest growth over the respective period. Eight of 10 sectors are expected to record an increase in sales/revenue when compared to net income reported for a comparable period one-year earlier.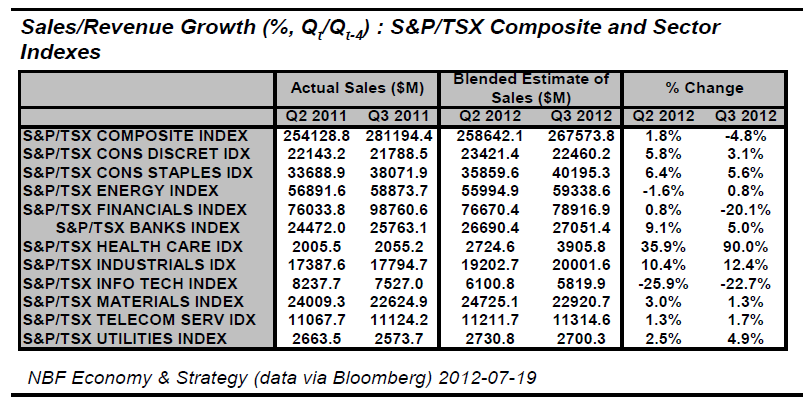
Profit Margin expectations
The S&P/TSX Composite index estimate of profit margin for the Q2 2012 calendar quarter is 10.5% which represents a growth rate of -15.5% (Qt/Qt-4). The estimate for the Q3 2012 calendar quarter is 10.8%, suggesting an annual growth of 4.1% (Qt/Qt-4).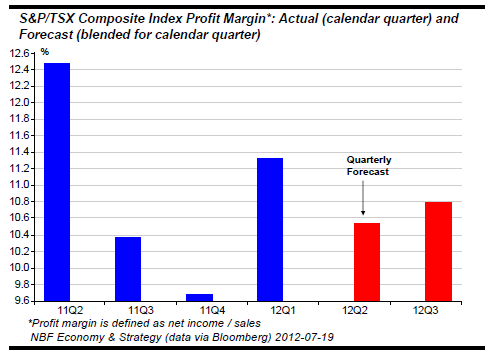
Profit margin expectations by sector (GICS Level 1)
From a sector perspective Consumer Discretionary (2.7%) and Industrials (0.9%) are expected to record the largest profit margin expansion for the Q2 2012 calendar quarter. The Information Technology (-89.3%) and Energy (-23.5%) sectors are expected to show the deepest profit margin contraction over the respective period. Two of 10 sectors are expected to record an increase in profit margins when compared to margins reported for a comparable period one-year earlier.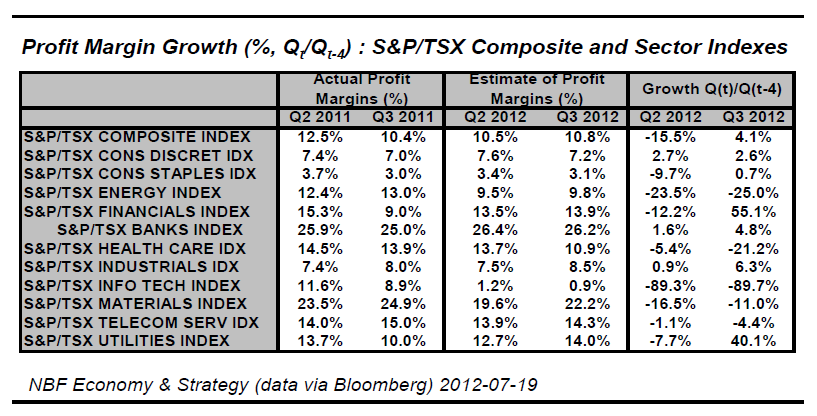
To Read the Entire Report Please Click on the pdf File Below.
- English (UK)
- English (India)
- English (Canada)
- English (Australia)
- English (South Africa)
- English (Philippines)
- English (Nigeria)
- Deutsch
- Español (España)
- Español (México)
- Français
- Italiano
- Nederlands
- Português (Portugal)
- Polski
- Português (Brasil)
- Русский
- Türkçe
- العربية
- Ελληνικά
- Svenska
- Suomi
- עברית
- 日本語
- 한국어
- 简体中文
- 繁體中文
- Bahasa Indonesia
- Bahasa Melayu
- ไทย
- Tiếng Việt
- हिंदी
S&P/TSX Composite Index: Earnings Season Report
Published 07/24/2012, 05:53 AM
Updated 05/14/2017, 06:45 AM
S&P/TSX Composite Index: Earnings Season Report
3rd party Ad. Not an offer or recommendation by Investing.com. See disclosure here or
remove ads
.
Latest comments
Install Our App
Risk Disclosure: Trading in financial instruments and/or cryptocurrencies involves high risks including the risk of losing some, or all, of your investment amount, and may not be suitable for all investors. Prices of cryptocurrencies are extremely volatile and may be affected by external factors such as financial, regulatory or political events. Trading on margin increases the financial risks.
Before deciding to trade in financial instrument or cryptocurrencies you should be fully informed of the risks and costs associated with trading the financial markets, carefully consider your investment objectives, level of experience, and risk appetite, and seek professional advice where needed.
Fusion Media would like to remind you that the data contained in this website is not necessarily real-time nor accurate. The data and prices on the website are not necessarily provided by any market or exchange, but may be provided by market makers, and so prices may not be accurate and may differ from the actual price at any given market, meaning prices are indicative and not appropriate for trading purposes. Fusion Media and any provider of the data contained in this website will not accept liability for any loss or damage as a result of your trading, or your reliance on the information contained within this website.
It is prohibited to use, store, reproduce, display, modify, transmit or distribute the data contained in this website without the explicit prior written permission of Fusion Media and/or the data provider. All intellectual property rights are reserved by the providers and/or the exchange providing the data contained in this website.
Fusion Media may be compensated by the advertisers that appear on the website, based on your interaction with the advertisements or advertisers.
© 2007-2024 - Fusion Media Limited. All Rights Reserved.
