
: 36.1%
VIX Status: 17.1
General (Short-term) Trading Call: Play the wedge – breakout or breakdown
Active T2108 periods: Day #4 under 40% (underperiod), Day #16 under 70% (underperiod)
Commentary
Incredibly, the tightening wedge on the S&P 500 remains mainly intact.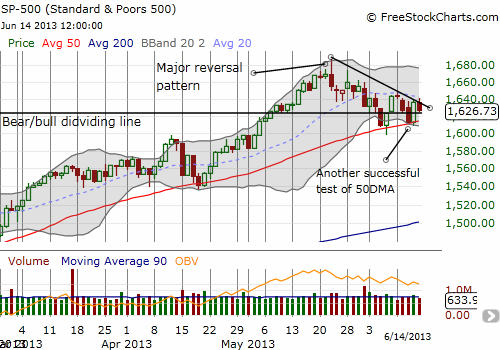
For 10 straight trading days the S&P 500 has effectively bounced between its 50DMA at support and the 20DMA as resistance. Right in the middle of the action is still the bear/bull dividing line providing a neat pivot. I have redrawn the downward trend excluding Friday’s action showing how in the last week this line has further constrained training. This churn is burning anyone who maintains a strong opinion on what the market “should” be doing. But space is running out in this wedge, and we should finally see a breakout or breakdown in the coming week. Conveniently, the Federal Reserve is announcing its latest on monetary policy on Wednesday which should provide a perfect catalyst to push the market into its next phase.
If I had to vote based on the VIX, the volatility index, I would vote for a breakdown. The VIX remains resilient and is now staying “aloft” for its longest duration of the year. For 10 of the last 11 trading days the VIX has closed above the 15.2 pivot. While the S&P 500 has churned, the VIX has strengthened its resolve. This resilience should be warning us of elevated concern for a resumption of the S&P 500′s correction.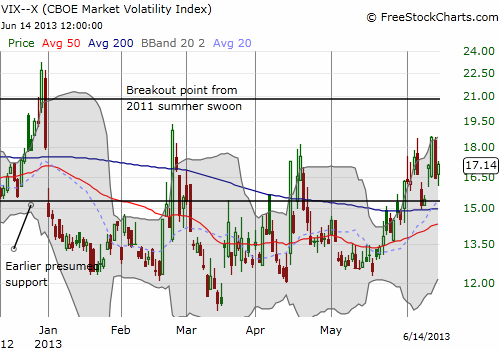
If I had to vote based on T2108, I would vote for a breakout. On Thursday, T2108 touched 30% before launching higher and closing at 39.3%. In recent years, 30% has often served as a floor for T2108, not quite reaching official oversold status at 20%. On Thursday, the S&P 500 cracked the 50DMA by a hair before turning on a dime and bumrushing right into the downtrend line. This move frustrated a lot of bears: for a hot minute, it looked like the S&P 500 would finally serve up the breakdown they have been expecting.
The most entertaining sequence has come from money manager Doug Kass as his tweets continue to emphasize all that is negative in the world. It is one of the best displays of confirmation bias – pick a position and look only for data that supports that position. I have noticed in recent weeks he has become particularly fond of retweeting material from ZeroHedge which has become notorious for supplying megaphones for permabears. Kass is also a converted fan of gold. This is just for a trade of course because at higher prices he was a very vocal gold-hater. Kass has become extremely prolific on twitter and clearly spends a lot of time tweeting and reading tweets during the trading day (especially Zero Hedge pieces).
Note I am NOT making fun of Kass here. I have a lot of respect for him and his consistent ability to stick firm to a contrarian viewpoint. I follow his tweets and even set it up so I get text messages on my phone. By following him so closely I have come to recognize a lot of patterns and consistent communication styles (also making me wonder what patterns I have!).
In particular, Kass predictably starts posting positively on the market after a sell-off that takes it low enough below some price target he has and negatively on the market when it is rallying above his target. A notable exception is the cheerleading of any stock he is holding that is rallying. In THAT case, he becomes similar to the rest of us who enjoy celebrating success on twitter. I did not post examples of those tweets. However, in all the time he has been hyping gold it has mainly churned in place, little different from the “memoryless” market he complains about when referring to the S&P 500. Confirmation bias is a tough habit for any of us to kick.
Why care about what Kass has to say? He has a large audience of almost 63,000 followers. In the investing and trading world this is a huge sphere of influence. It has the potential to move positions in some cases. Kass is also well-known for making some big market calls, especially calling a bottom in March, 2009. He is a regular guest on CNBC and has a well-known active love/hate relationship with the infamous Jim Cramer. Most importantly, he drops nuggets of insight that serve as a check on my own biases. I just wish I could get him to answer more of my tweets to him.
Anyway, sorry for the large sidetrack on Kass, but this is context to the action on Thursday. Kass fought the rally all day and in the end concluded that quants went crazy using algorithms to drive the market in the “wrong” direction. My eyes perked up because my own algorithm in the form of the T2108 Trading Model (TTM) had predicted a down day based on Wednesday’s close. I was instead positioned for a rally given the TTM earlier Wednesday predicted a rally if the market had closed when I checked it intraday. (See the last T2108 Update for details). Kass reminded me that my own model and algorithms are competing with others coming to their own conclusions.
In Thursday’s case, even the dumbest algorithm could have made one of two simple simple conclusions: 1) short on the break of the 50DMA, or 2) BUY a retest of the 50DMA. The shorts got it wrong and were likely reminded that these signals are best followed AFTER a close and maybe even confirmation with follow-through on the next day. Kass also thinks of technicals as voodoo although he freely picks and chooses technical perspectives that agree with his own analysis. On Thursday, I took note of his awareness of 1624 on the S&P 500 as technical resistance. It easily gave way. As the chart above shows, this bear/bull dividing line has quickly matured from simple support and resistance to an important pivot point, a true dividing line. I am guessing Kass would not have hated the quants so much on Thursday if their algorithms had respected this line as resistance!
Anyway, I was very fortunate to make profits on my large gathering of SSO calls. I was grateful even though my early exit left about another 33% on the table by the Thursday’s close. The lesson I got from this experience is that I need to run a sensitivity analysis on the T2108 Trading Model. I plan to add code to test out the robustness of the prediction if any one of the parameters deviates by a “reasonable” amount. It will be like a voting machine (for you machine learning types, think Adaptive Boosting or AdaBoost). If the preponderance of votes lean in the direction of the main prediction based on the close, I will increase my confidence in the prediction. I hope to make this adjustment in the coming weeks. In the meantime, I will stick with the current method and try to do some manual sensitivity checks that will include examining the decision tree for the classification model for any quirks that would make the current prediction prone to instability.
In summary, I expect the S&P 500 to break out of this wedge in the coming week, most likely driven by a Fed-inspired reaction and/or counter-reaction. Out of respect for T2108, I am leaning bullish, but I will instantly turn bearish on a CLOSE below the 50DMA that gets follow-through. NOTE WELL – I am not likely to trade on that bearishness, at least not on the S&P 500, because at that point T2108 should be rapidly approaching oversold conditions. I am VERY eager to test out the TTM and my overhauled T2108 methods on oversold conditions. Just as I did not get automatically bearish with overbought conditions (thank goodness!), I will not get automatically bullish with classic oversold conditions. I will run the numbers and respect the odds…and the technicals.
Finally, two more important trades I announced on twitter: I am again long puts on Caterpillar (CAT) that turned out well-timed as CAT failed to break resistance at its 50DMA. I also dove right back into puts on First Solar (FSLR) after it cracked $45 (I really should have just stuck with my previous put spread and stayed as patient as I was coming into the sell-off – they did not expire until July). 
Black line: T2108 (measured on the right); Green line: S&P 500 (for comparative purposes)
Red line: T2108 Overbought (70%); Blue line: T2108 Oversold (20%)
Be careful out there!
Disclosure: long CAT shares and puts; long FSLR puts; long GLD
- English (UK)
- English (India)
- English (Canada)
- English (Australia)
- English (South Africa)
- English (Philippines)
- English (Nigeria)
- Deutsch
- Español (España)
- Español (México)
- Français
- Italiano
- Nederlands
- Português (Portugal)
- Polski
- Português (Brasil)
- Русский
- Türkçe
- العربية
- Ελληνικά
- Svenska
- Suomi
- עברית
- 日本語
- 한국어
- 简体中文
- 繁體中文
- Bahasa Indonesia
- Bahasa Melayu
- ไทย
- Tiếng Việt
- हिंदी
S&P 500: Churn And Burn
T2108 Status
3rd party Ad. Not an offer or recommendation by Investing.com. See disclosure here or
remove ads
.
Latest comments
Install Our App
Risk Disclosure: Trading in financial instruments and/or cryptocurrencies involves high risks including the risk of losing some, or all, of your investment amount, and may not be suitable for all investors. Prices of cryptocurrencies are extremely volatile and may be affected by external factors such as financial, regulatory or political events. Trading on margin increases the financial risks.
Before deciding to trade in financial instrument or cryptocurrencies you should be fully informed of the risks and costs associated with trading the financial markets, carefully consider your investment objectives, level of experience, and risk appetite, and seek professional advice where needed.
Fusion Media would like to remind you that the data contained in this website is not necessarily real-time nor accurate. The data and prices on the website are not necessarily provided by any market or exchange, but may be provided by market makers, and so prices may not be accurate and may differ from the actual price at any given market, meaning prices are indicative and not appropriate for trading purposes. Fusion Media and any provider of the data contained in this website will not accept liability for any loss or damage as a result of your trading, or your reliance on the information contained within this website.
It is prohibited to use, store, reproduce, display, modify, transmit or distribute the data contained in this website without the explicit prior written permission of Fusion Media and/or the data provider. All intellectual property rights are reserved by the providers and/or the exchange providing the data contained in this website.
Fusion Media may be compensated by the advertisers that appear on the website, based on your interaction with the advertisements or advertisers.
© 2007-2024 - Fusion Media Limited. All Rights Reserved.