- Historical volatility projection suggests the range of probable S&P 500 prices from around 1750 to 2050 by year-end
- Major trend indicators suggest high probability of prices ending in the lower half of the probability range
- GAAP P/E and forward operating P/E ratios reverting to 5-year and 10-year averages suggest prices in the 1700’s
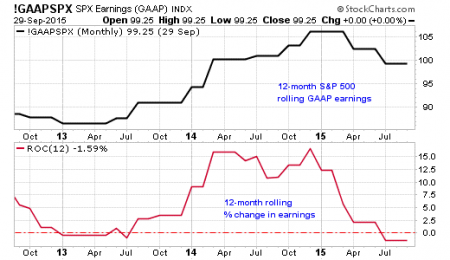
- GAAP earnings have turned down and prices tend to follow
- But GAAP earnings yield relative to current and near-term prospective 10-Year Treasury yield is supportive of current index price
- out 3 months based on historical volatility
- valuation level reverting to a “normal” valuation (not an overshoot) based on historical price GAAP and forward operating earnings estimates; and GAAP earnings yield relative to historically normal 10-year Treasury yields.
As you might imagine, the phone has been busy these past few days with nervous inquiries.
The prevailing questions are about direction of the US stock market and the magnitude of likely price change.
DIRECTION
I have written before with a negative outlook, based on objective data mostly about breadth; simple price chart behavior and patterns; and recent declines in quarterly earnings — but tempered by the continued market supporting aspects of the Treasury yield curve.
Our 4 factor major trend reversal indicator is suggesting a major trend change to a downward direction.
None of that attempts to fathom events and conditions around the world, but merely examines the final result of all that is going as expressed in earnings, price changes and trading volume.
So, my conclusion is that the probabilities (not certainty) is for the Correction to continue into a Bear.
A Correction is a 10% price decline from the trialing 1-year high. A Bear is 20% price decline from the trailing 1-year high, which decline is sustained at that level or worse for at least 2 months.
MAGNITUDE
Let’s look at that two ways:
These are all projections, but based on reasonable and historically justified calculations.
Volatility-Based Price Probability Projections
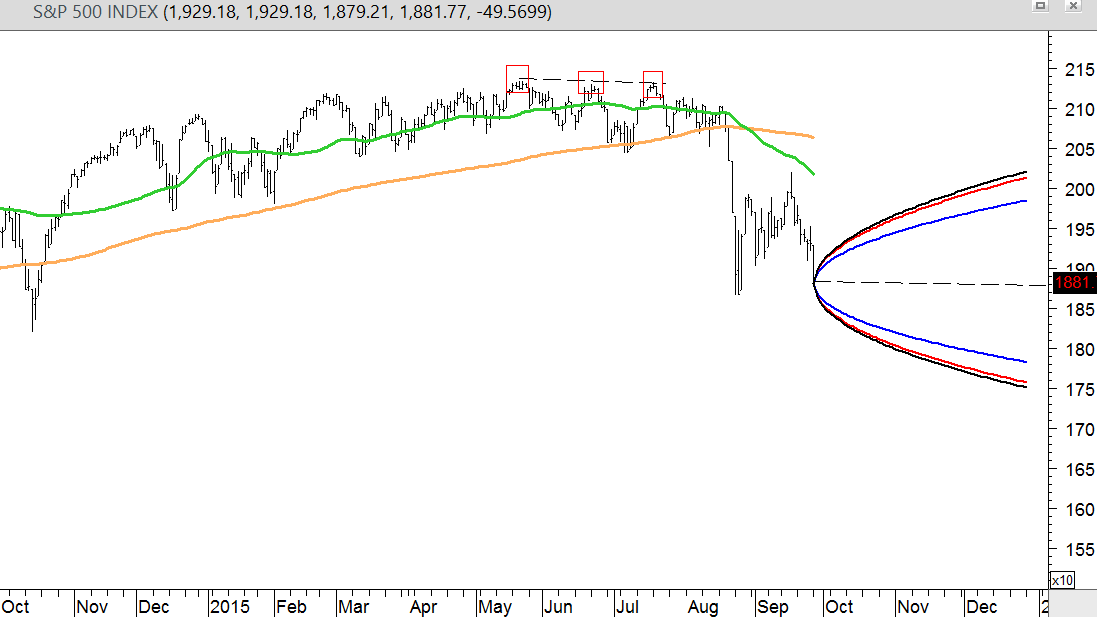
This daily S&P 500 chart plots three horizontal cones projected three months into the future (to 12/28/2015) based on the 1-month, 3-month and 12-month historical volatility of the S&P 500 index, and using a 67% probability range.
That means prices would be expected to remain within the cone area with a 67% probability if the prices form a normal probability distribution (no “fat tails” and ignoring historical positive skew).
Such volatility projections are non-directional (they show price range potential equal on the upside and downside), but we believe the Direction is to the downside based on the other data we have evaluated in prior articles.
The trailing index high price is 2132. The current price is 1881. The 12/28/2015 end-points of the volatility cone range from 1784 to 1752.
The current price is below the trailing high by 11.8%
1784 is 16.3% below 2132
1752 is 17.8% below 2132
These are not posited as end points of a Bear, but just 3-month (year-end) values at the outer boundary of 67% probability.
Notice that the upper probability bound by year-end is for about a 60% retracement of the decline from the peaks in July to the trough in August
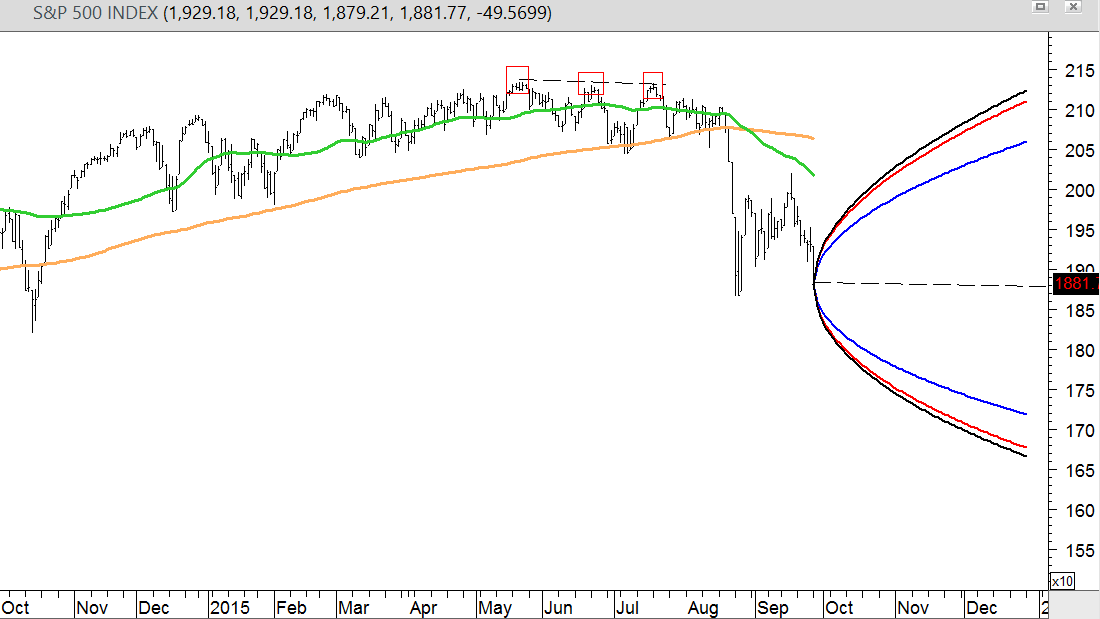
Let’s now look at the 90% probability range.
The trailing index high price is 2132. The current price is 1881. The 12/28/2015 end-points of the volatility cone range from 1720 to 1667.
The current price is below the trailing high by 11.8%
1720 is 19.3% below 2132
1667 is 21.8% below 2132
These are not posited as end points of a Bear, but just 3-month (year-end) values at the outer boundary of 90% probability.
Notice that the upper probability bound by year-end is for about a 100% retracement of the decline from the peaks in July to the trough in August
GAAP Earnings P/E Valuation Reversion to 5-Yr or 10-Yr Average
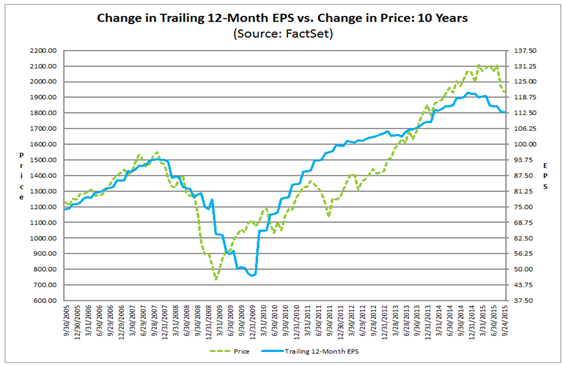
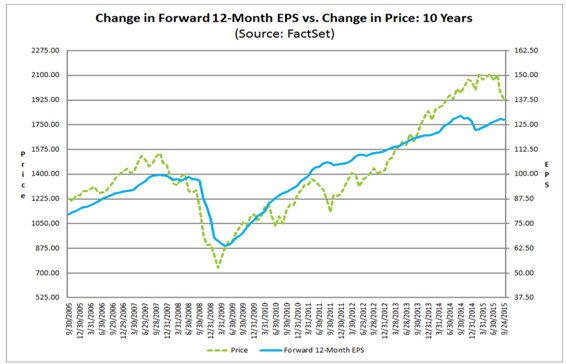
Valuation is about earnings. Trailing reported GAAP earnings are trending down as this FactSet Earnings Insight chart shows (the blue line) and stock prices are following (the green line).
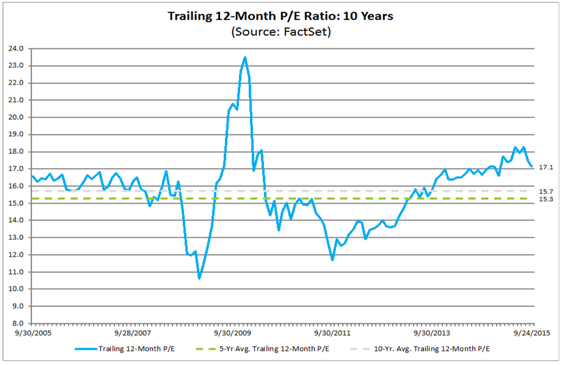
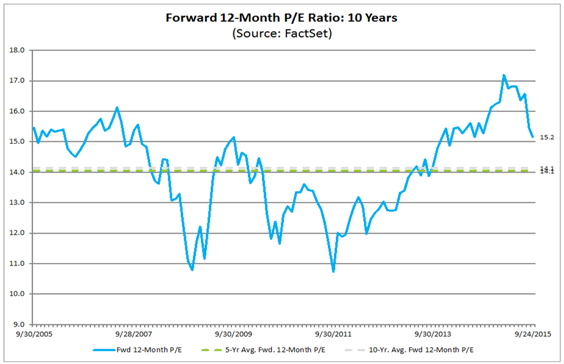
The P/E on 12-month trailing reported GAAP earnings last Thursday was 17.1x compared to a 10-year average of 15.7x and a 5-year average of 15.3x. After yesterday’s (09/28) market action the trailing P/E was 16.6x (at index price 1882).
If the P/E reverted to the 5-year average, the index price would be about 1734 (18.7% below the trailing high index price of 2132). It would be 1790 at the 10-year average P/E (16% below the index high).
During the European debt crisis in 2011, the P/E went down to less than 12x. At 12x (not a projection, just a data point), the index would be priced at 1360 (36.6% below the index high – a severe Bear).
Forward Operating Earnings P/E Valuation Reversion to 5-Yr or 10-Yr Average
Forward operating earnings estimates were trending down, but have risen, and are not nearly flat as this FactSet Earnings Insight chart shows (the blue line) and stock prices are following (the green line).
The P/E on 12-month forward operating earnings last Thursday was 15.2x compared to a 10-year average of 14.1x and a 5-year average of 14.05x. After yesterday’s (09/28) market action the trailing P/E was 14.75x (at index price 1882).
If the P/E reverted to the 5-year average, the index price would be about 1740 (18.4% below the trailing high index price of 2132). It would be 1746 at the 10-year average P/E (18.2% below the index high).
During the European debt crisis in 2011, the P/E went down to less than 11x. At 11x (not a projection, just a data point), the index would be priced at 1404 (34.1% below the index high – a severe Bear).
Earnings Yield Relative to 10-Year Treasury Yield
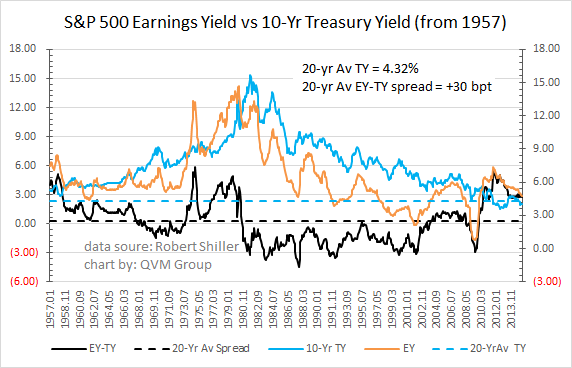
The S&P 500 earnings yield (inverse or P/E – it is E/P) is 5.27%. The 10-Year Treasury yield is 2.05%. The spread is 3.22%. The 20-year average spread is 0.30%. That is very supportive of current prices.
The 20-year average 10-year Treasury yield is 4.32%. If the 10-year Treasury yields were at is 4.32% average, today’s earnings yield would be 0.95% greater. That would still be more favorable to stocks that the historical averages. A 4.32% 10-year Treasury is nowhere is sight.
It’s hard to make an argument that the current earnings yield (and thus the P/E) is unreasonable in the current interest rate environment if earnings were stable, or in the rate environment that is likely within the next year or so.
Unfortunately, earnings are not stable and are in decline. The uncertainty is whether those who expect earnings to decline in 2016 or those who think they will rise are correct.
Earnings Direction and Price Direction
Earnings have turned down, and stocks tend to follow – and if the turn down is significant, it can create enough downward momentum in stocks to create a Bear.
This chart shows how the index price varies with the direction and magnitude of change in earnings.
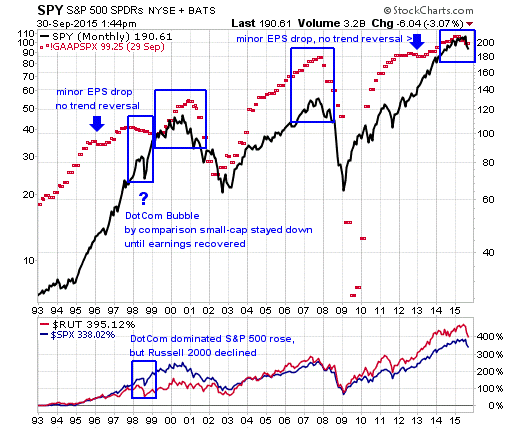
You can see that when earning make a significant downturn, the index changes trend from up to down.
The failure of the S&P 500 to make that change in the late 1990’s was due to the fact that most of the popular DotCom stocks that dominated the index then were not making money or expected to do in the near-term. Note, however, that the Russell 2000 small-cap index which was not dominated by DotCom stocks did respond to declining earnings, although not with a major trend change.
This chart gives a magnified view of the change in earnings over the last 3 years.
Clearly, profits have been down all of 2015 so far (and stocks are down for 2015 so far).
SUMMARY
If earnings were stable and growing all would be well, but earnings are not stable, are not currently growing.
A sufficient number of experts are concerned that earnings may not do well in the near-term that caution is warranted.
The consensus street estimate for year-end S&P 500 price is in the 2100 to 2200 range.
Let’s hope that is true and that we are wrong, but until and unless that recent chart trend and earnings trend is reversed to the upside, the weight of evidence is for S&P 500 prices to reside in the lower half of the probability ranges shown in the cones at the top of this article (from around 1900 to the mid 1700’s).

