Before the market opened we got a mixed pair of economic indicators. The initial jobless claims report was a major disappointment, the biggest increase in 13 months. In contrast, the advance look at November Retail Sales came in a bit better than expected. The S&P 500 tossed a coin and opened fractionally lower before rising to its miniscule 0.04% intraday high fifteen minutes later. The index then sold off to its -0.56% intraday lunch-hour low. An afternoon rally led to a promising peak into the green, but the final hour belonged to the sellers, who took the index to a 0.38% closing loss.
Here is a 15-minute look at the past five sessions, which opens with Friday's big move on the November Jobs Report. After Monday's fractional 0.18%, the index has posted three consecutive declines. Are we seeing the start of an overdue correction? That's not something we usually associate with December.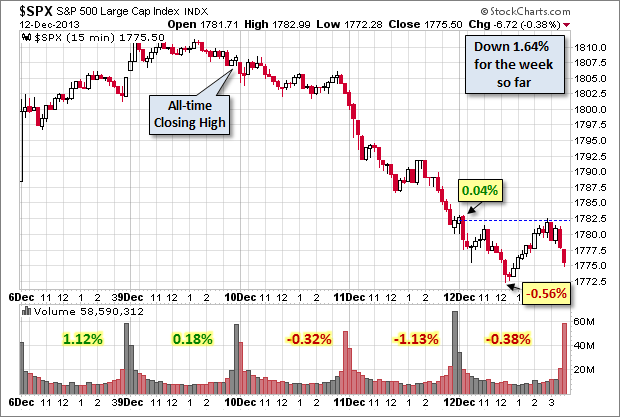
Here is a daily chart of the SPY ETF, where we get a better sense of trading volume of individual investors. Today's decline was approximately at its 50-day moving average and well off the spike on yesterday's greater decline.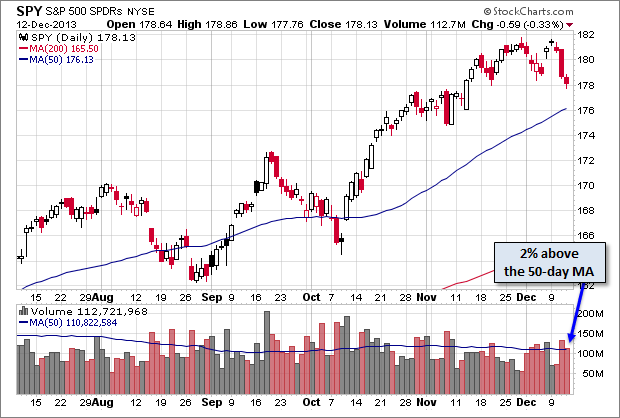
A daily chart of the index itself shows less volume volatility over the past three sessions.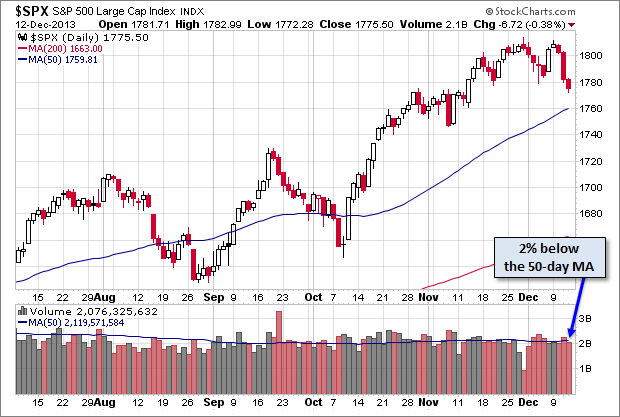
The S&P 500 is now up 24.49% for 2013 and 1.82% below the all-time closing high of December 9.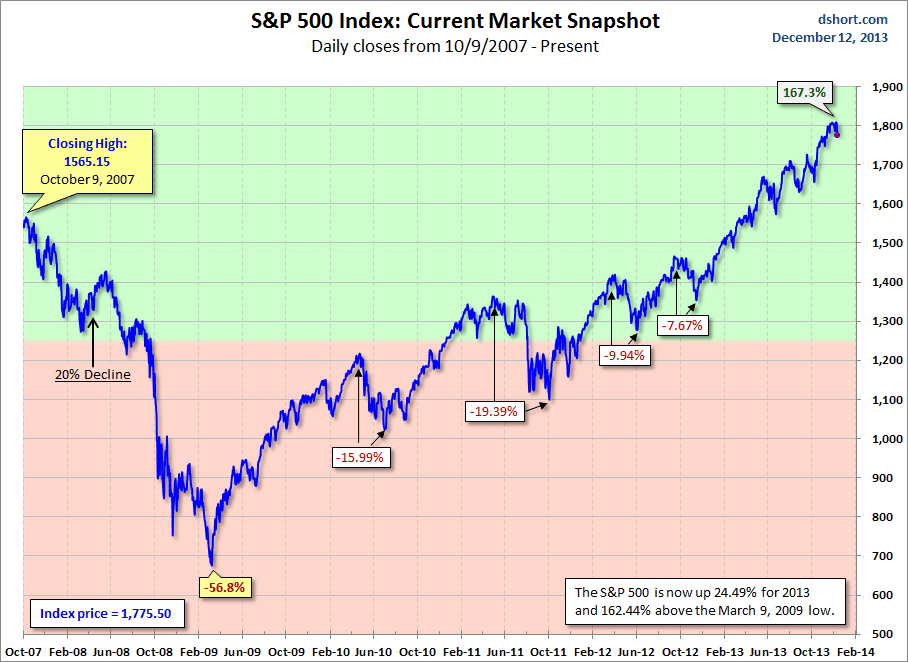
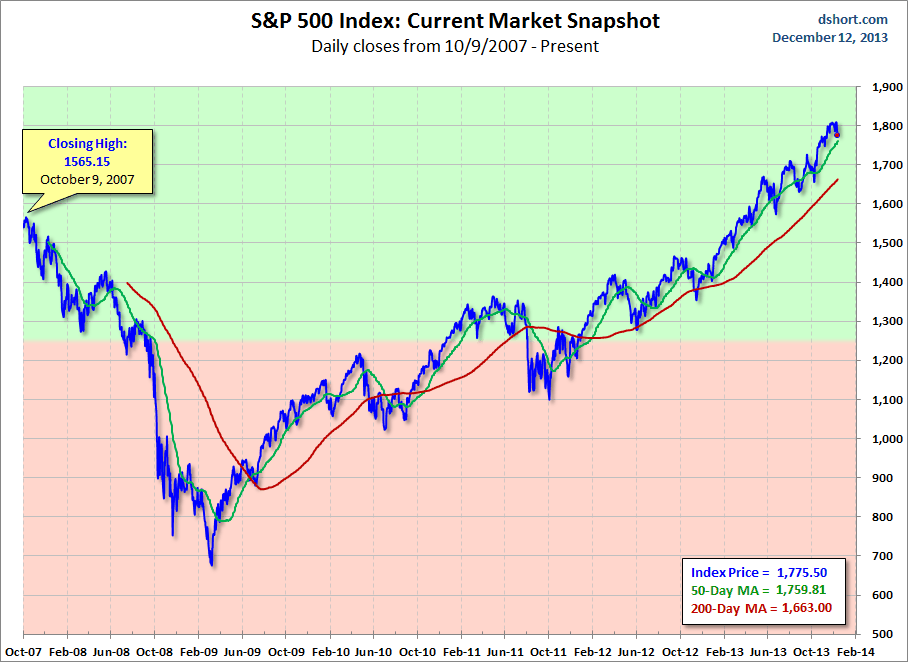
For a better sense of how these declines figure into a larger historical context, here's a long-term view of secular bull and bear markets in the S&P Composite since 1871.
- English (UK)
- English (India)
- English (Canada)
- English (Australia)
- English (South Africa)
- English (Philippines)
- English (Nigeria)
- Deutsch
- Español (España)
- Español (México)
- Français
- Italiano
- Nederlands
- Português (Portugal)
- Polski
- Português (Brasil)
- Русский
- Türkçe
- العربية
- Ελληνικά
- Svenska
- Suomi
- עברית
- 日本語
- 한국어
- 简体中文
- 繁體中文
- Bahasa Indonesia
- Bahasa Melayu
- ไทย
- Tiếng Việt
- हिंदी
S&P 500 Snapshot: Third Day Down
Published 12/13/2013, 01:15 AM
Updated 07/09/2023, 06:31 AM
S&P 500 Snapshot: Third Day Down
3rd party Ad. Not an offer or recommendation by Investing.com. See disclosure here or
remove ads
.
Latest comments
One month no gain. Just like, last July-August. We can use a healthy 10% correction.
Install Our App
Risk Disclosure: Trading in financial instruments and/or cryptocurrencies involves high risks including the risk of losing some, or all, of your investment amount, and may not be suitable for all investors. Prices of cryptocurrencies are extremely volatile and may be affected by external factors such as financial, regulatory or political events. Trading on margin increases the financial risks.
Before deciding to trade in financial instrument or cryptocurrencies you should be fully informed of the risks and costs associated with trading the financial markets, carefully consider your investment objectives, level of experience, and risk appetite, and seek professional advice where needed.
Fusion Media would like to remind you that the data contained in this website is not necessarily real-time nor accurate. The data and prices on the website are not necessarily provided by any market or exchange, but may be provided by market makers, and so prices may not be accurate and may differ from the actual price at any given market, meaning prices are indicative and not appropriate for trading purposes. Fusion Media and any provider of the data contained in this website will not accept liability for any loss or damage as a result of your trading, or your reliance on the information contained within this website.
It is prohibited to use, store, reproduce, display, modify, transmit or distribute the data contained in this website without the explicit prior written permission of Fusion Media and/or the data provider. All intellectual property rights are reserved by the providers and/or the exchange providing the data contained in this website.
Fusion Media may be compensated by the advertisers that appear on the website, based on your interaction with the advertisements or advertisers.
© 2007-2024 - Fusion Media Limited. All Rights Reserved.
