China + Weak Momentum = Selloff
When the stock market goes sideways, as it did for the last month, it speaks to waning bullish momentum. Weak momentum in isolation is not bearish, but it leaves the market vulnerable to bad economic news. China delivered some Thursday.
From Bloomberg
Chinese factory output may contract this month, a preliminary survey from HSBC Holdings Plc and Markit Economics signaled today as the People’s Bank of China added further funds to the financial system to ease a cash shortage.
Checking In With The Market’s Pricing Mechanism
When markets begin to do things they have not done for some time, it is time to pay closer attention. Both the stock and bond markets were attempting to clear some “we have not seen this in a while” hurdles during Thursday’s trading session.
2011: Bond Demand Was Waving Yellow Flags
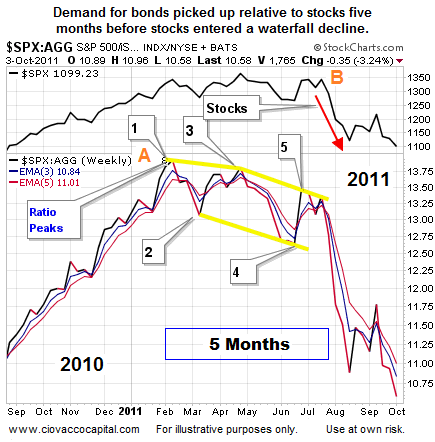
As investors, we would prefer to reduce our exposure to stocks prior to, or in the early stages of, a sharp decline in prices (see point B below). The meat of the chart below tracks investor demand for stocks (SPY) relative to bonds (AGG). When the ratio falls, it is indicative of rising demand for conservative bonds relative to growth-oriented stocks. Notice the ratio was making a series of lower highs and lower lows (see 1-5 below) before the plunge in stocks near point B. Rising fear was observable five months before point B, sending a “be careful with stocks” signal.

2014: Subtle Changes Worth Noting
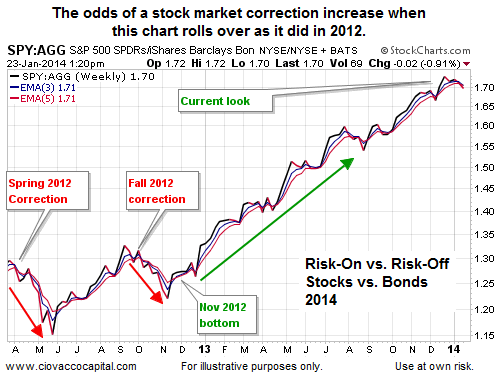
How does the stock vs. bond poll look after the bad data from China? A little more concerning for the “risk-on” crowd. The demand for conservative bonds has been increasing relative to growth-oriented stocks. If the chart below morphs into a “2012 correction look”, our concerns about stocks will increase.

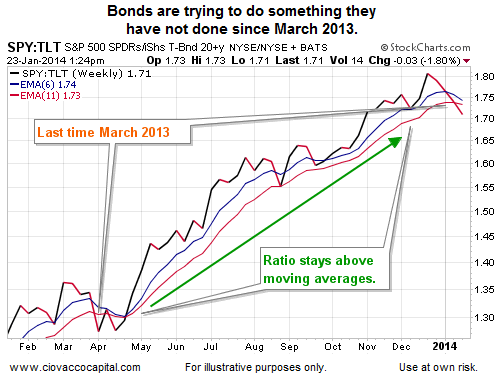
Treasuries – Not Since March 2013
Over the past ten months, long-term Treasury bonds (TLT) have been unable to find enough buying support to push the SPY/TLT ratio below the blue and red moving averages. If the chart can hold the look below into Friday’s close, it will increase the odds of further weakness in risk assets. Increasing demand for defensive Treasuries typically aligns with increasing concerns about the economy and earnings.

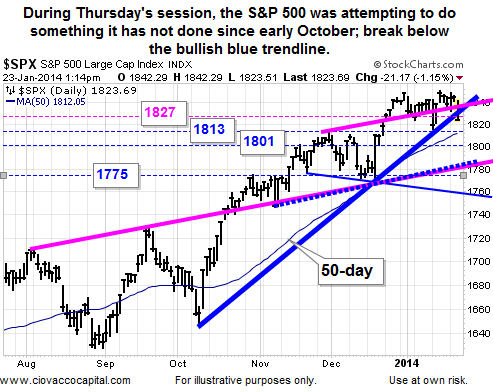
Stocks: Not Since Early October
The news from China also increased the conviction of sellers, allowing the S&P 500 to test the blue trendline from the October 2013 low.

Investment Implications
Depending on how Thursday’s session closes, the observable evidence has deteriorated in a manner that may call for two chess moves: (1) a reduction in our exposure to stocks, and (2) redeployment of some cash into more-defensive-oriented bonds. If conditions continue to worsen, our market model will call for further rebalancing between stocks and conservative assets. We continue to hold U.S. stocks (VTI), financials (XLF), technology (QQQ), small caps (IJR), Europe (FEZ) and global stocks (VT). However, we may hold less of them before the week is out.
