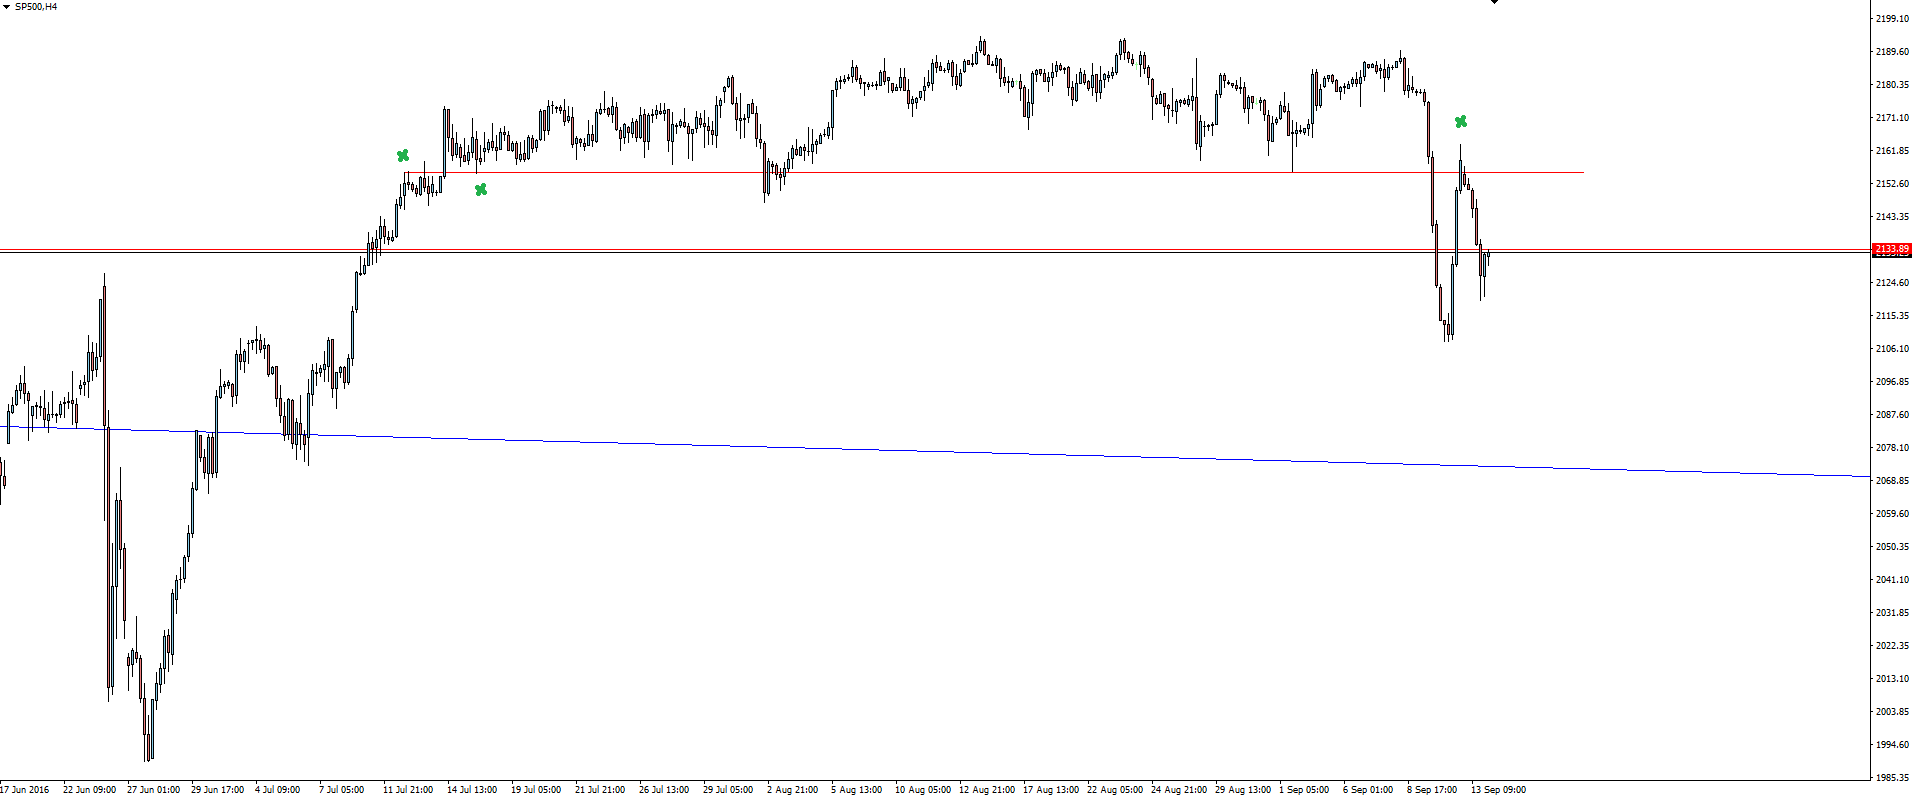
The volatility on every trader’s lips continued overnight, with stocks rejecting off the bottom of this technical range after retesting previous support as resistance.
S&P 500 4 Hourly:
In yesterday’s blog I was looking for price to simply tuck back in and reactivate the range, but a wider wave of risk aversion kept stocks from rallying this session and sent price back down again. Frustrating for a technical trader, but an essential aspect of trading indices that highlights why we manage our risk around key levels.
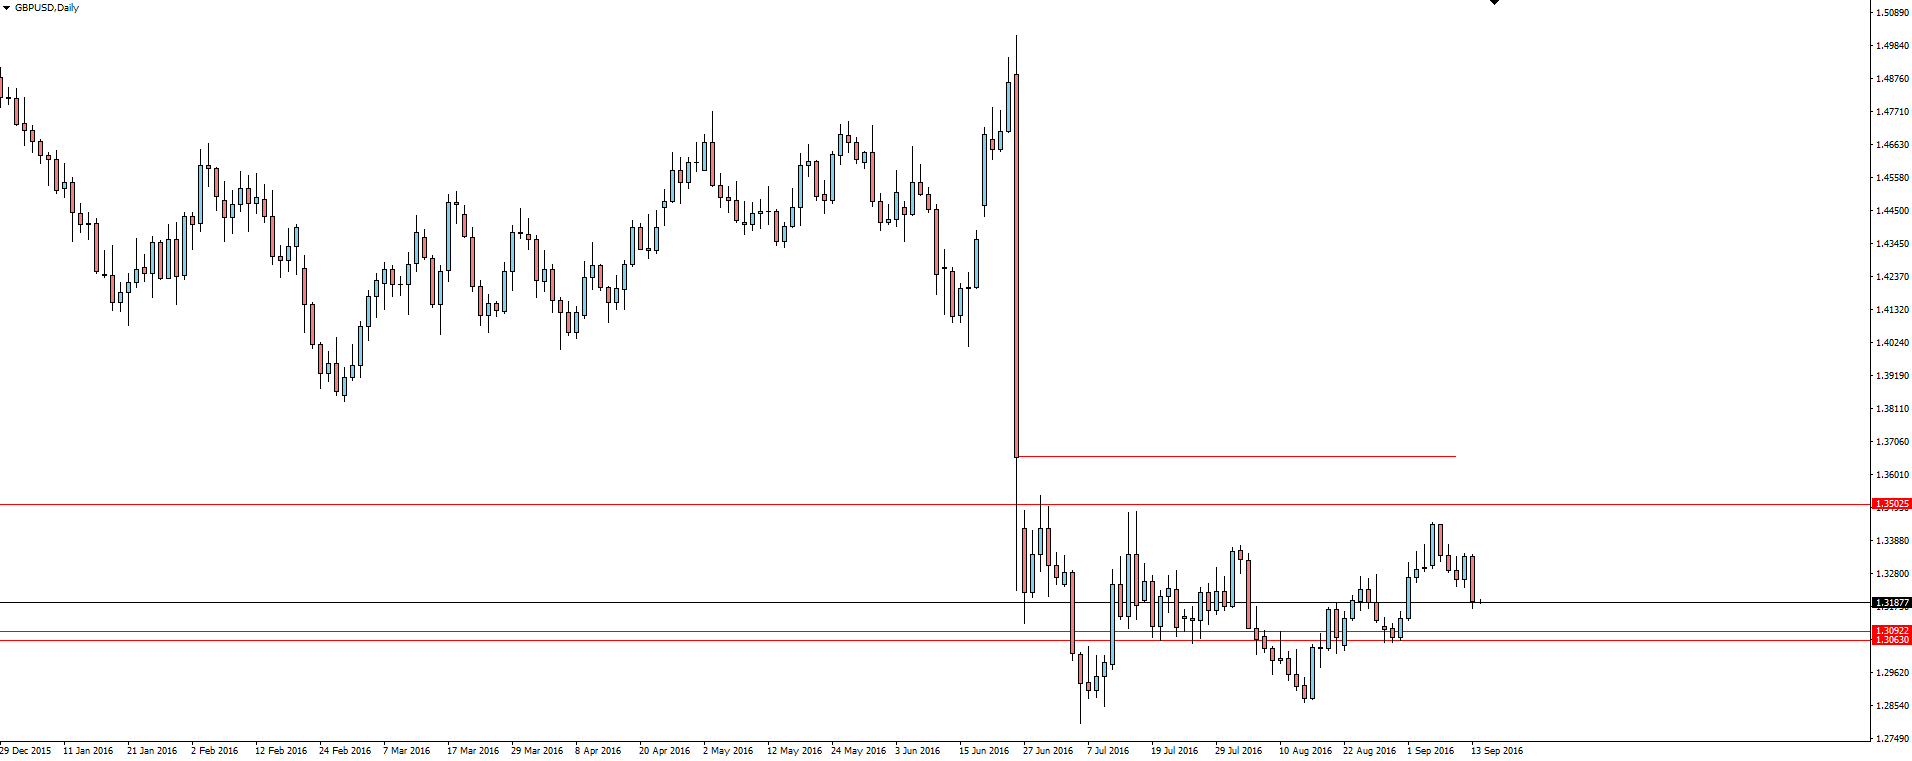
Over in the Forex space, this wave of risk aversion saw Cable tumble, printing the pair’s largest daily decline in a month.
GBP/USD Daily
Since we are at record low levels, we’ve spoken before about the post-Brexit drop price action being all that really matters.
Sure price has pulled back, but it’s still sitting above the support/resistance level we’ve been managing our risk around and most importantly still inside this obvious 700 pip range at the bottom.
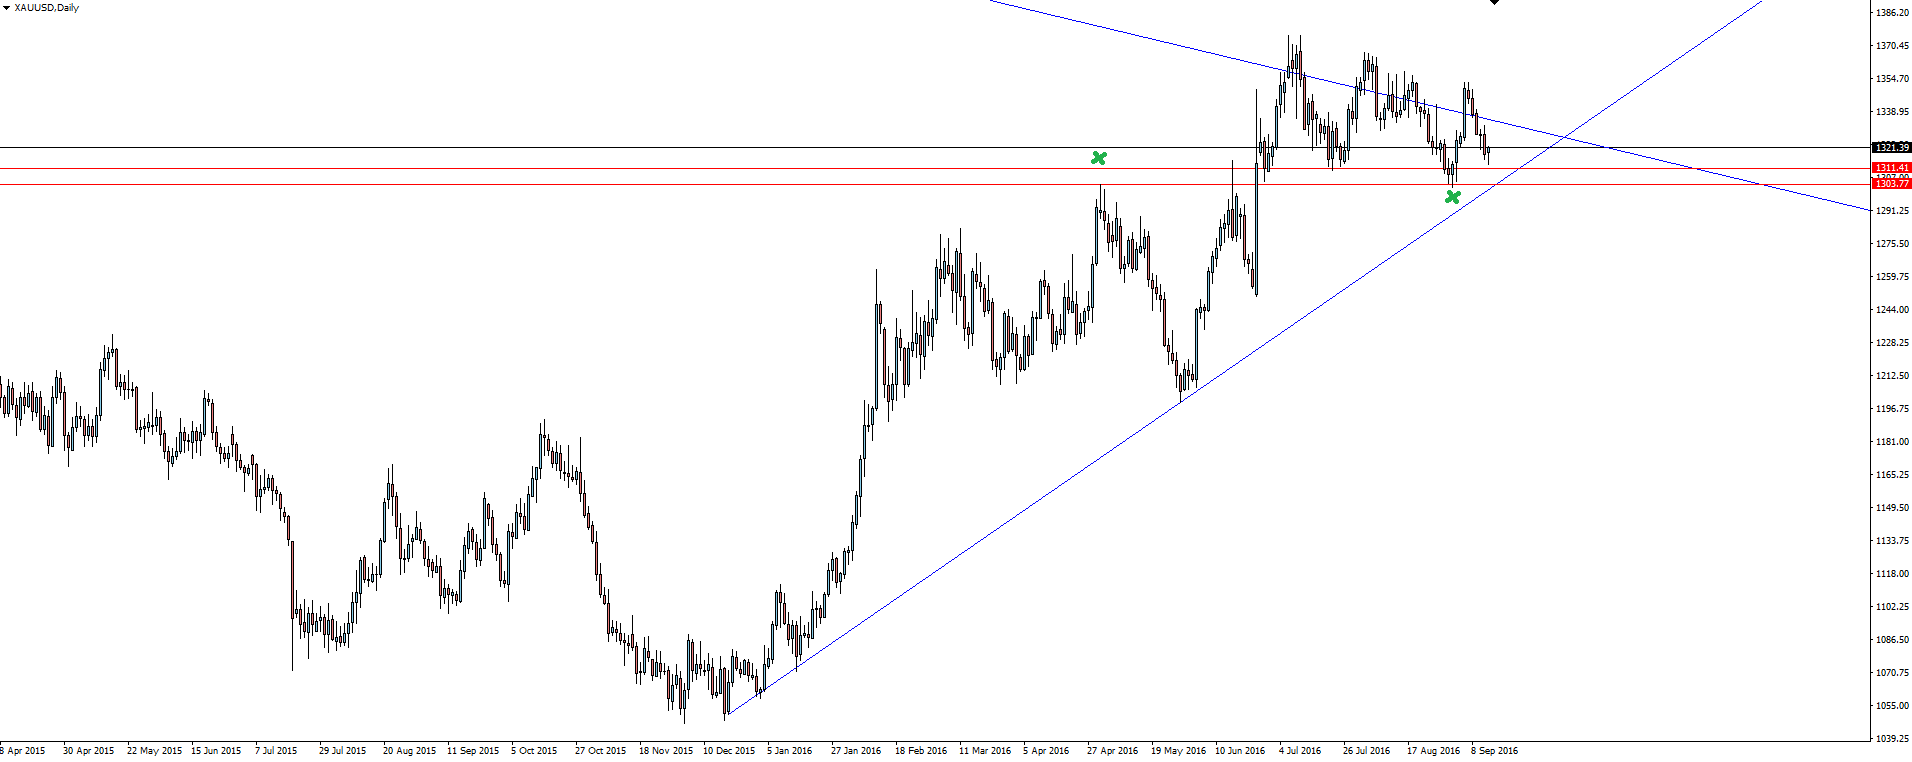
Moving onto the commodities front, Gold continues to reject off higher time frame resistance.
As long as price is still above this key level, things don’t really change. It’s a weekly level so should be treated more as a zone than a hard level. While hovering around the zone, price should still be seen as at resistance whether its broken the level or not.
As we’ve talked about before, I do still really like the horizontal level I have marked above. A level that risk can continue to be managed around.
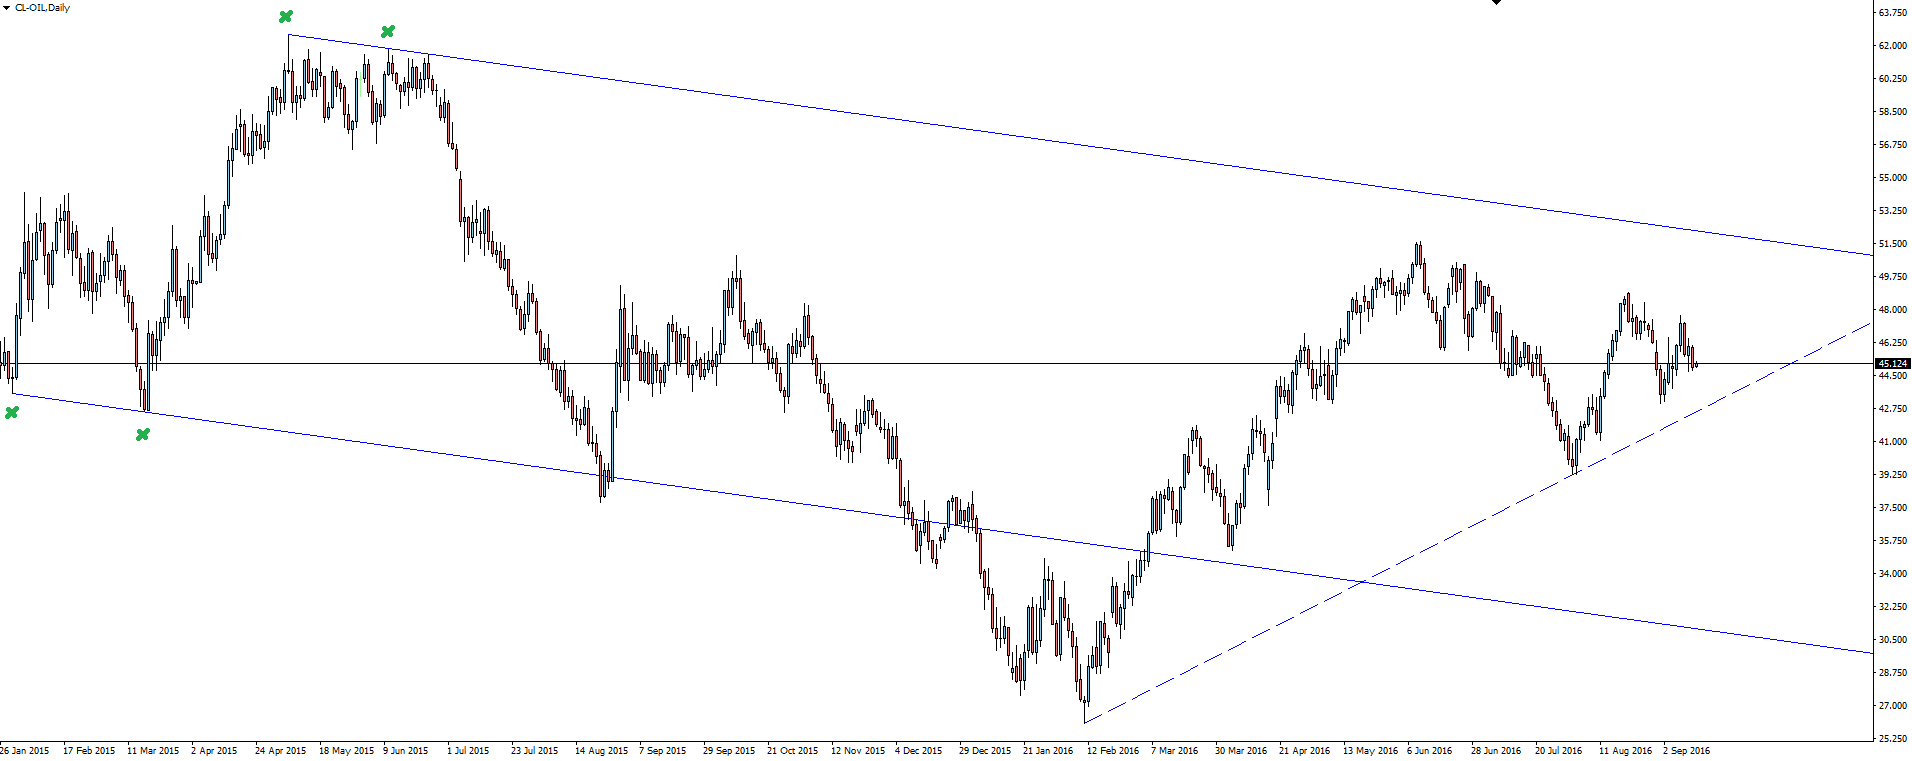
Crude Oil Daily:
Oil is another of the commodities that is in the news thanks to an IEA report stating that world stockpiles will continue to accumulate resulting in further oversupply.
Now we know that Oil headlines are unreliable and should be taken with a grain of salt, but the lurches that they cause mean price jolts back and forward through support/resistance levels on our charts.
Like the above chart, I still like to keep the original levels that are chopped through on the back of headlines that are proved to be misleading, as they are often reactivated at a later date. With this in mind, these lines will be interesting to watch.
Now as you can see on the economic calendar tonight, we have crude oil inventories out of the US. This release is the change in the number of barrels of crude oil held in inventory by commercial firms during the past week, and is expected to show their biggest increase since April.
If you have a position in Oil, this number will be hugely significant. For instant access to data releases such as the US crude oil inventories, make sure you have your News Terminal Platform open rather than refreshing your browser manually.
Risk Disclosure: In addition to the website disclaimer below, the material on this page prepared by Forex broker Vantage FX Pty Ltd does not contain a record of our prices or solicitation to trade. All opinions, forex news, research, tools, prices or other information is provided as general market commentary and marketing communication – not as investment advice. Consequently, any person acting on it does so entirely at their own risk. The expert writers express their personal opinions and will not assume any responsibility whatsoever for the Forex account of the reader. We always aim for maximum accuracy and timeliness, and FX broker Vantage FX shall not be liable for any loss or damage, consequential or otherwise, which may arise from the use or reliance on this service and its content, inaccurate information or typos. No representation is being made that any results discussed within the report will be achieved, and past performance is not indicative of future performance.

