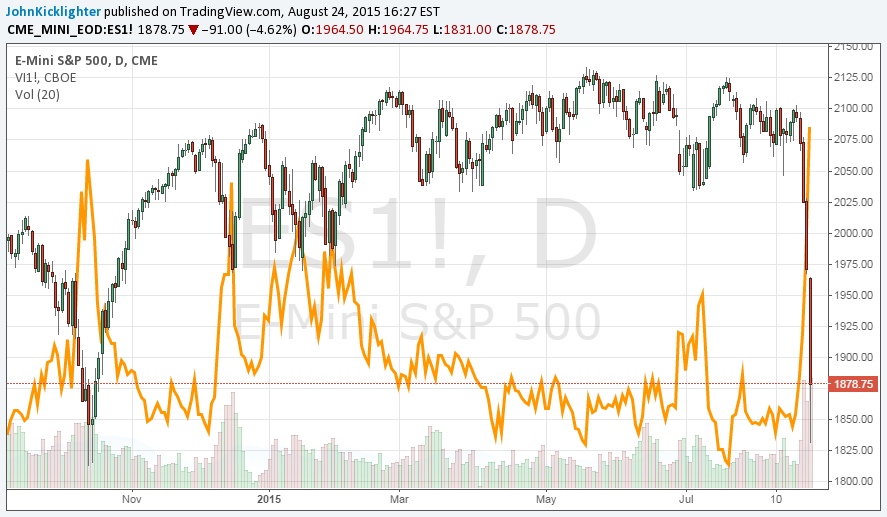
Risk aversion turned severe for certain corners of the financial system to start this week. In particular, equities faced extraordinary selling pressure which led to dramatic declines in stock benchmarks and the volatility indexes that are derived from their options. However, the threat likely runs deeper than just this recent aggressive drop reflects. While we can look at individual stocks, currencies or asset classes and identify factors to show how over-leveraged it might be; there is a systemic exposure that speaks more broadly to the risks that the market faces. And, to truly appreciate how much more selling we may face, it is important to understand the position of sentiment.
The vast majority of coverage in the financial market’s bludgeoning Monday was dedicated to the equity market. In particular, the S&P 500 suffered a remarkably severe stumble. The drop on the day was the single biggest in four years and the volume behind e-mini futures (futures are taking up more of the speculation than outright shares and the index) hit a similar historical peak. From the VIX, the surge was not only a multi-year high but one of the largest notional jumps in the index on record.
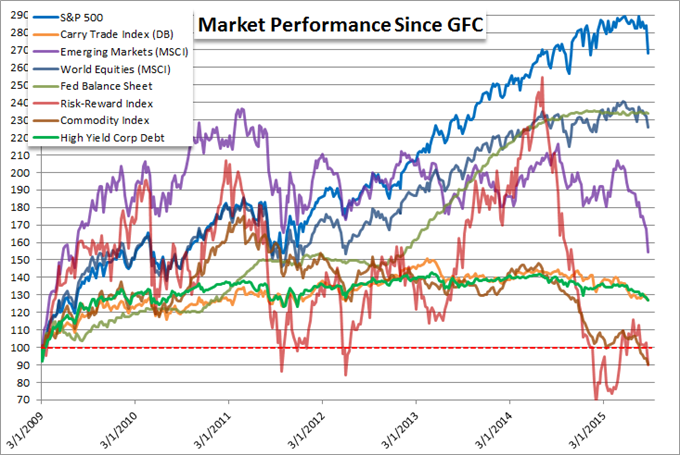
However, the rapidly deflating sentiment is not isolated to US shares. In fact, in many respects US markets were one of the last to capitulate. In recent months, we have seen the Shanghai Composite and other Chinese equities drop sharply from excessive levels. Benchmarking performance further back — to the start of the boom from March 2009 — benchmarks like the S&P 500 and Dow Jones Industrial Average built up far more aggressive gains and held out far longer.
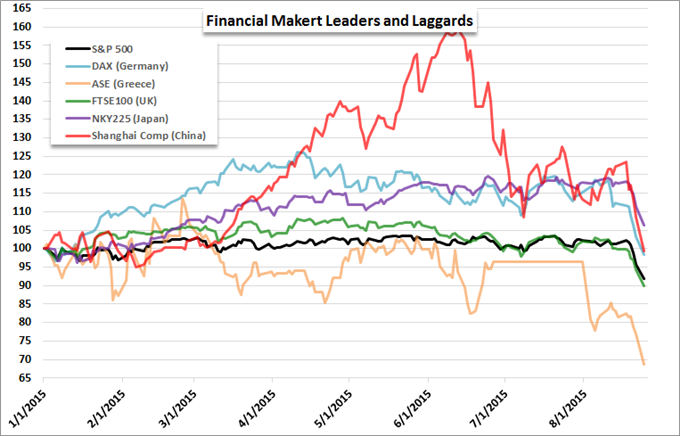
There is significant premium that can still be worked off in US and global equities. However, the exposure is not just isolated to shares. Speculative excess — a side effect of monetary policy, moral hazard, years of moderate growth and homogeneity of speculative expectations — is still a broad exposure that can be worked down. As we see the various markets with a ‘risk’ bearing to them align under the same selling banner, we are seeing evidence of a sentiment based shift that can feed a much more endemic financial market move. Strong evidence of that elemental shift can be seen in the shared performance of the very different assets selling off below.
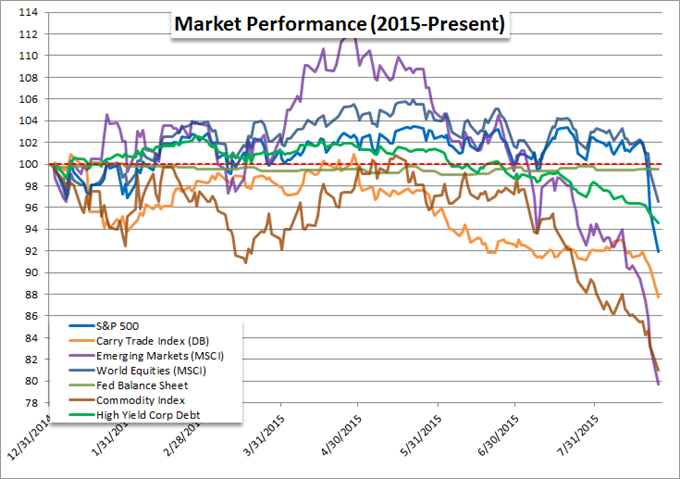
While concerted risk aversion plagues many assets that maintain a speculative ranking, there are certain markets that have more excess to work off than others. For example, US equities are more extreme than their global counterparts, while shares as an entire asset class are still sporting significantly more premium than emerging markets or high-yield debt. That is likely due to the speculative-to-investor ratio in the different markets — investors are slower moving.
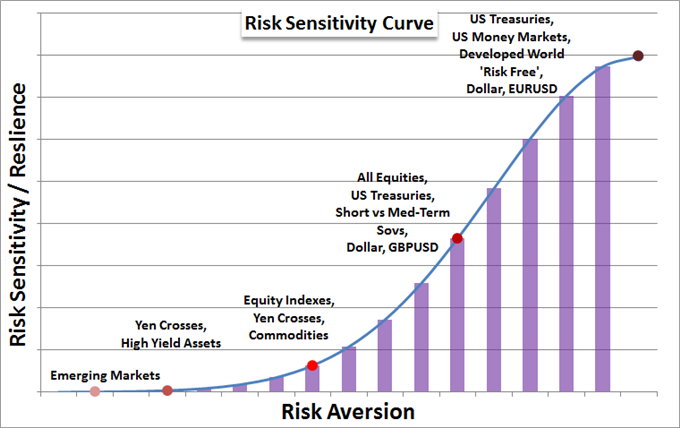
Risk aversion is a fundamental theme that can burn for far longer than most other catalysts. Therefore, it deserves are attention. To see how deep and persistent the burning continues, it will be important to keep track of both facets of ‘breadth’ and ‘intensity’. Those combined factors are represented below, where the intensity of risk aversion moves from selling pressure in just the most sensitive of asset classes to the more express intent of ‘protecting capital at all costs’.
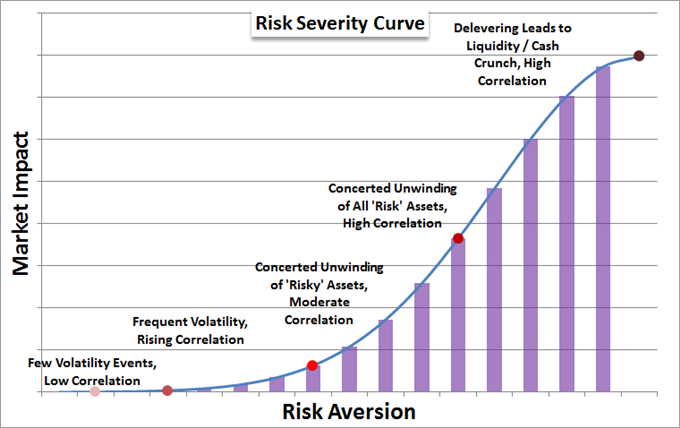
A more distinct means for measuring that intensity is to keep tabs on different asset classes with varying connections to sentiment. Emerging market, high yield and equities coming under selling pressure are indicative of a moderate ‘risk aversion’. When we get to the point where Treasuries and dollars are bid as a means to protect funds (reversing the latter’s recent trend), then we are seeing an escalation.
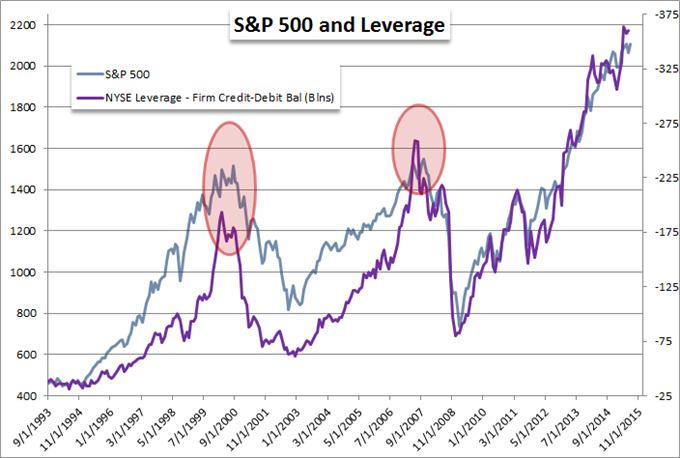
For capacity of further risk aversion, there is plenty of fuel for this fire. In terms of notional leverage, investors have used borrowed funds heavily in an attempt to bad lackluster returns. The rate of natural return in the market is anemic at best, and gearing was one of the few ways money managers could outpace a market benchmark (S&P 500) that was generating remarkably consistent gains. Below we can see leverage employed in US equities at the brokerage level.
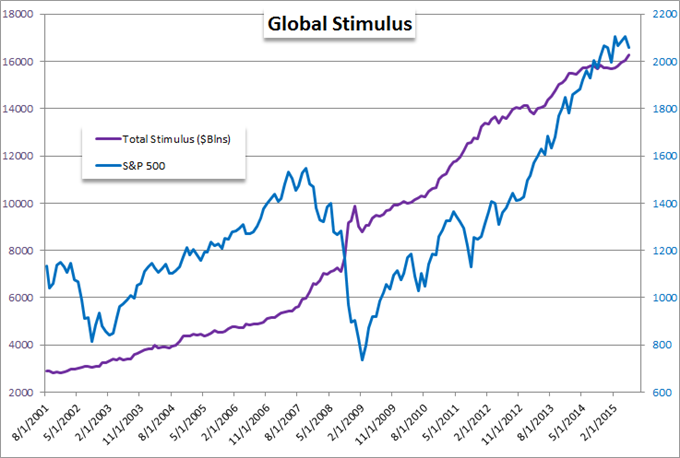
Leverage is not just a notional issue however, it is also a thematic exposure. Expectations of a backstopped world with central bank support encouraged investors to take on more risk. While it is not a direct causation, the S&P 500 and other speculative market banners climbed on the back of central banks’ unspoken guarantee. Unfortunately, they never promised to keep markets afloat indefinitely – and in fact, they couldn’t even if they wanted to. Eventually, their risk exposure would hit excessive levels and they — like any other market participant — would have met a saturation level.
Should risk aversion deepen, expect the different markets and currencies to realign to their traditional risk standing. There is a transitional phase where excessive carry in the likes of the dollar (long) and euro (short) will support unusual standings. However, if the theme continue and deepen, the dollar will revive its liquidity haven status while the euro will slump as capital seeks out sounder harbors.


