Get 40% Off
👀 👁 🧿 All eyes on Biogen, up +4,56% after posting earnings. Our AI picked it in March 2024.
Which stocks will surge next?
Unlock AI-picked Stocks

Richmond Fed: Manufacturing Dropped 13 Points

Published 08/26/2015, 12:31 AM
Updated 07/09/2023, 06:31 AM

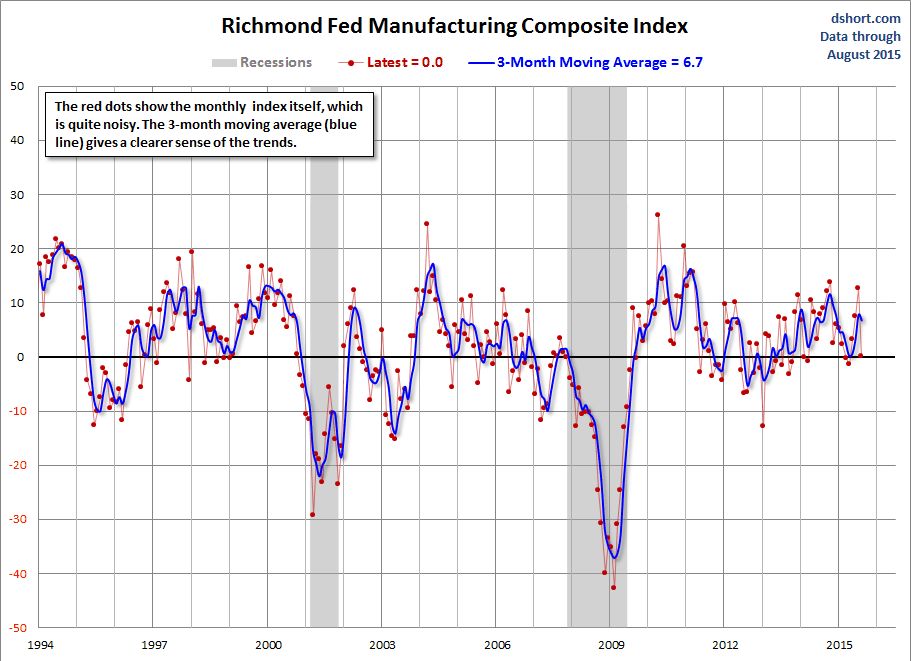
Yesterday the Richmond Fed Manufacturing Composite Index dropped 13 points to 0 from last month's 13. Investing.com had forecast a decrease to 9. Because of the highly volatile nature of this index, we include a 3-month moving average to facilitate the identification of trends, now at 6.7, indicating expansion.The complete data series behind today's Richmond Fed manufacturing report (available here), which dates from November 1993.

Here is a snapshot of the complete Richmond Fed Manufacturing Composite series:
Richmond Fed Manufacturing Chart

Here is the latest Richmond Fed manufacturing overview.

Fifth District manufacturing activity slowed in August, according to the most recent survey by the Federal Reserve Bank of Richmond. Shipments and order backlogs decreased, while new orders flattened this month. Manufacturing hiring softened this month; however, average wages continued to increase at a moderate pace. Prices of raw materials rose more slowly in August, while prices of finished goods grew slightly faster compared to last month.

Despite the soft current conditions, producers remained optimistic about future business conditions. Expectations were for solid increases in shipments and in the volume of new orders in the six months ahead, with increased capacity utilization. In addition, manufacturers looked for rising backlogs and longer vendor lead times.

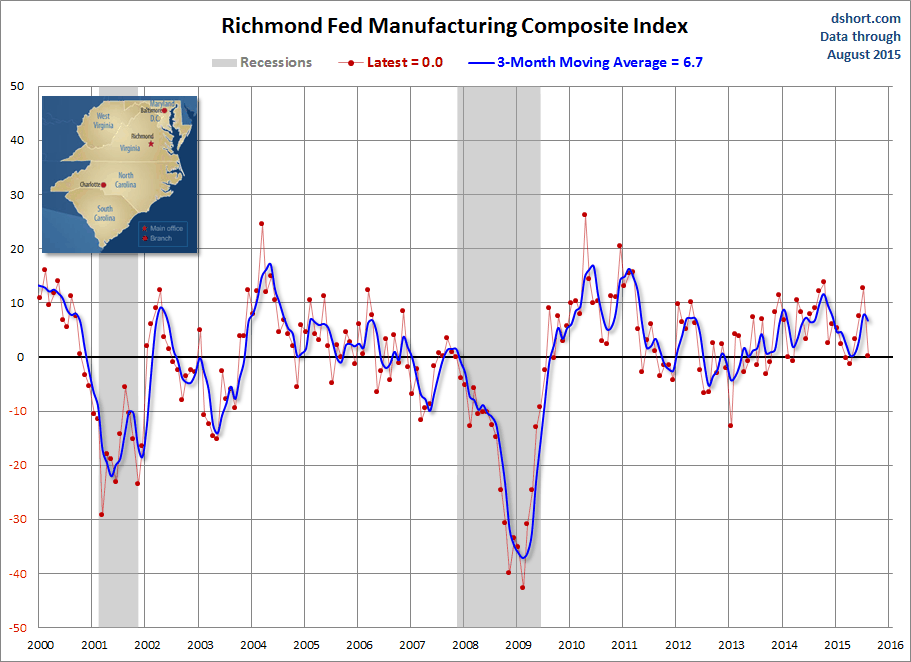
Here is a somewhat closer look at the index since the turn of the century.
Richmond Fed Manufacturing Since 2000 Chart

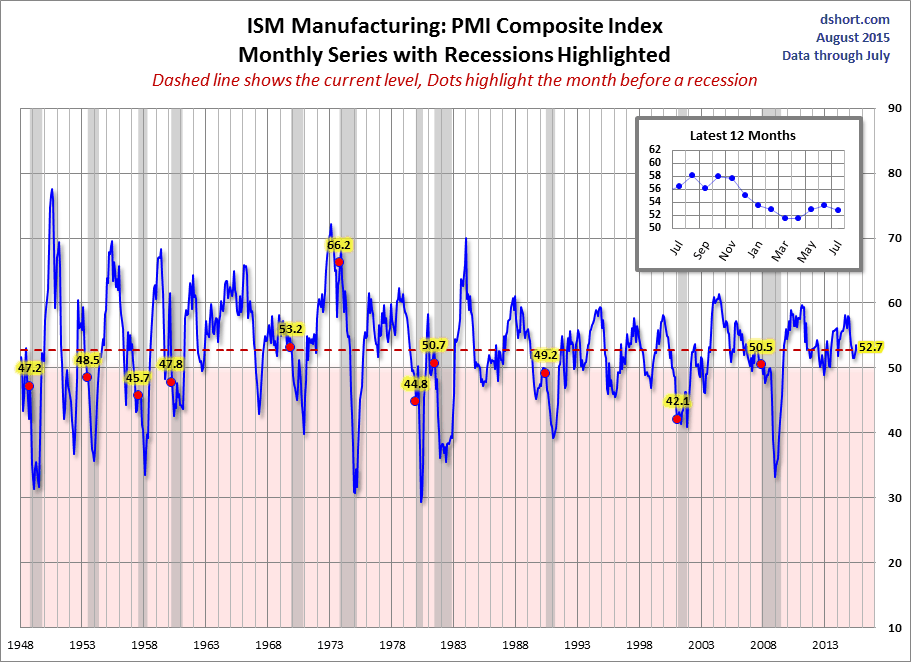
Is today's Richmond composite a clue of what to expect in the next PMI composite? We'll find out when the next ISM Manufacturing survey is released (below).
ISM: PMI Monthly Series Chart

Because of the high volatility of this series, we should take the data for any individual month with the proverbial grain of salt.

3rd party Ad. Not an offer or recommendation by Investing.com. See disclosure here or remove ads .

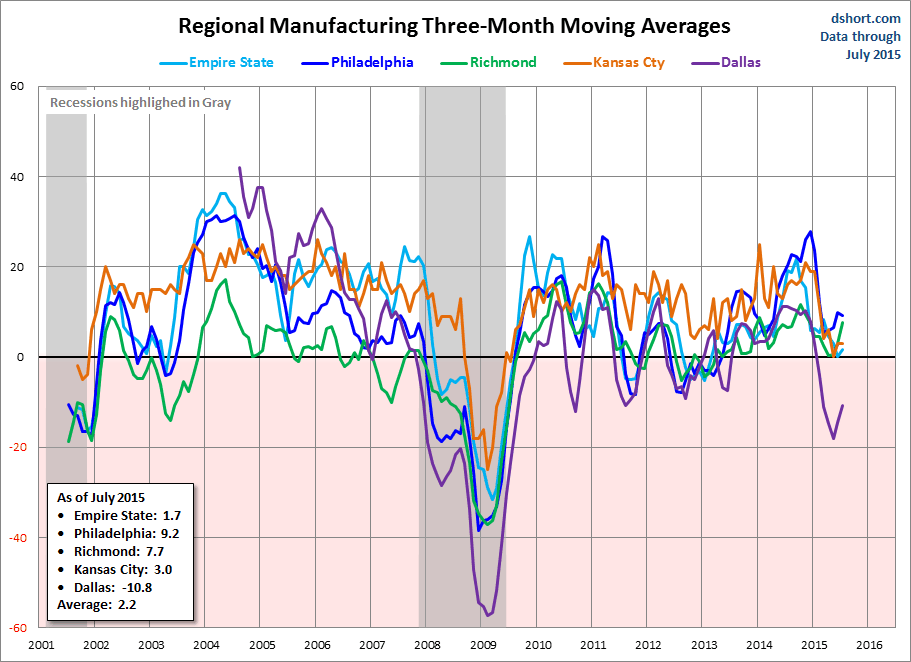
Let's compare all five Regional Manufacturing indicators. Here is a three-month moving average overlay of each since 2001 (for those with data):
Regional Manufacturing 3-Month Moving Averages Chart

Here is the same chart including the average of the five. Readers will notice the range in expansion and contraction between all regions - this averages out to approximately zero for the average, which is flat and neither expanding nor contracting.
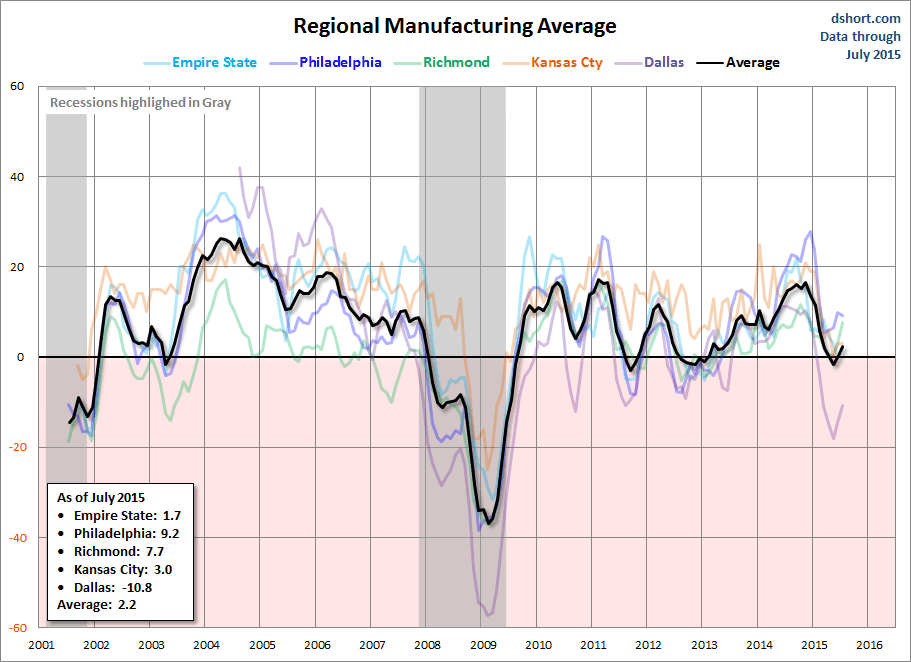
Regional Manufacturing Average Chart

Here are the remaining four monthly manufacturing indicators that we track:

Latest comments

Risk Disclosure: Trading in financial instruments and/or cryptocurrencies involves high risks including the risk of losing some, or all, of your investment amount, and may not be suitable for all investors. Prices of cryptocurrencies are extremely volatile and may be affected by external factors such as financial, regulatory or political events. Trading on margin increases the financial risks.
Before deciding to trade in financial instrument or cryptocurrencies you should be fully informed of the risks and costs associated with trading the financial markets, carefully consider your investment objectives, level of experience, and risk appetite, and seek professional advice where needed.
Fusion Media would like to remind you that the data contained in this website is not necessarily real-time nor accurate. The data and prices on the website are not necessarily provided by any market or exchange, but may be provided by market makers, and so prices may not be accurate and may differ from the actual price at any given market, meaning prices are indicative and not appropriate for trading purposes. Fusion Media and any provider of the data contained in this website will not accept liability for any loss or damage as a result of your trading, or your reliance on the information contained within this website.
It is prohibited to use, store, reproduce, display, modify, transmit or distribute the data contained in this website without the explicit prior written permission of Fusion Media and/or the data provider. All intellectual property rights are reserved by the providers and/or the exchange providing the data contained in this website.
Fusion Media may be compensated by the advertisers that appear on the website, based on your interaction with the advertisements or advertisers.
© 2007-2024 - Fusion Media Limited. All Rights Reserved.