The only remaining point of interest in the Q1 earnings season is the Retail sector, which is the only one that has any meaningful number of reports still awaited. Beyond Retail, the Q1 earnings season has actually ended for 10 of the 16 sectors in the S&P 500 index and effectively ended for the others.
The Retail sector had a good run this earnings season, with growth rates and surprises not only coming in better other recent periods, but also better than most of the other sectors. But the Macy`s Inc (NYSE:M) report indicates that the going will be tougher for department stores and others whose reports are still to come. The retail environment is no doubt difficult, with consumers hesitant to spend their energy savings. The government’s April Retail Sales report showed ‘headline’ sales flat or down in three of the last four months.
Including today’s Retail sector earnings reports, we now have Q1 results from 23 of the 41 retailers in the S&P 500 index. Total earnings for these retailers are +6.9% on +11.2% higher revenues, with 87.0% beating EPS estimates and 52.2% coming ahead of revenue estimates.
Please note that the sector’s earnings beat ratio is the highest in the S&P 500 index, while the revenue beat ratio is the third highest in the index. The side-by-side comparison charts below show how the sector’s results are tracking notably better relative to other recent periods.

The sector’s strong results notwithstanding, the double-digit revenue growth rate is a bit misleading as it reflects easy comparisons at Walgreens Boots Alliance Inc (NASDAQ:WBA) and the outsized gains at Amazon (NASDAQ:AMZN). Take these two companies out of the results thus far and the sector’s revenue growth rate drops to +6.3% - still reasonably good. We will see in the coming days if this momentum can be maintained or not, but Macy’s report likely shows that we should temper our expectations, particularly from the department stores.
Q1 Scorecard (as of May 13th, 2015)
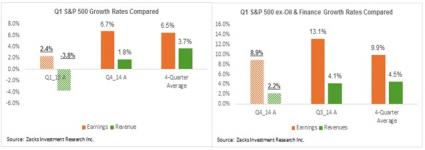
Total earnings for the 458 S&P 500 members that have reported results already are up +2.4% on -3.8% revenues, with 65.4% beating EPS estimates and only 43.7% coming ahead of top-line expectations.
As we have stated repeatedly in this space since the start of this reporting cycle, this is weak performance compared to what we have seen from the same group of 458 S&P 500 members in other recent periods. (Please note that we provide the scorecard for the Russell 2000 index on page 16 of the detailed report).
The two side-by-side charts below give a historical context to the results thus far – by comparing the Q1 earnings & revenue growth rates (left-hand side chart) and earnings & revenue beat ratios (right-hand side chart) with what these same companies achieved in the preceding quarter as well as the 4-quarter average.

Three things stand out as we look at the results thus far
First, the revenue weakness is very notable. We knew that growth will be problematic in Q1, so the weak revenue growth rate of -3.8% compared to other recent periods isn’t that surprising. But the very low proportion of companies beating revenue estimates is surprising and likely indicative that the growth backdrop has been even weaker than what was reflected in consensus estimates.
Second, the earnings growth rate (+2.4%) is also weak relative to what we saw from the same group of companies in 2014 Q4 and the 4-quarter average. While the Finance sector has been a positive growth contributor, the Energy sector’s impact has been in the opposite direction. Excluding contribution of these two sectors, the Q1 growth picture still compares to unfavorably other recent periods, as the right hand-side chart below shows.

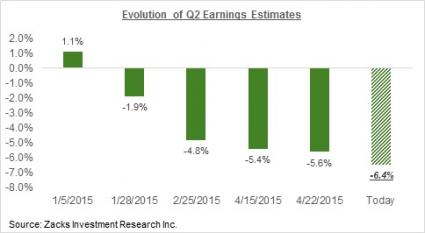
Third, as has been the norm in recent quarters, management teams continue to guide lower for the current and following quarters. As a result, estimates for the current quarter, which had fallen quite a bit already in solidarity with the Q1 estimate cuts, have started coming down even more. The chart below shows how earnings growth estimates for Q2 have evolved since the beginning of the year.

The dollar issue has added to the Energy sector’s woes and some concerns about the U.S. economic picture in bringing down this year’s estimates. Current consensus estimates show earnings growth for the S&P 500 to be in the negative for the first three quarters of the year, with the growth rate for the full-year now modestly in the negative. The expectation is that the growth picture starts improving in the last quarter of the year, with the growth pace ramping up to double-digit rates in 2016.
