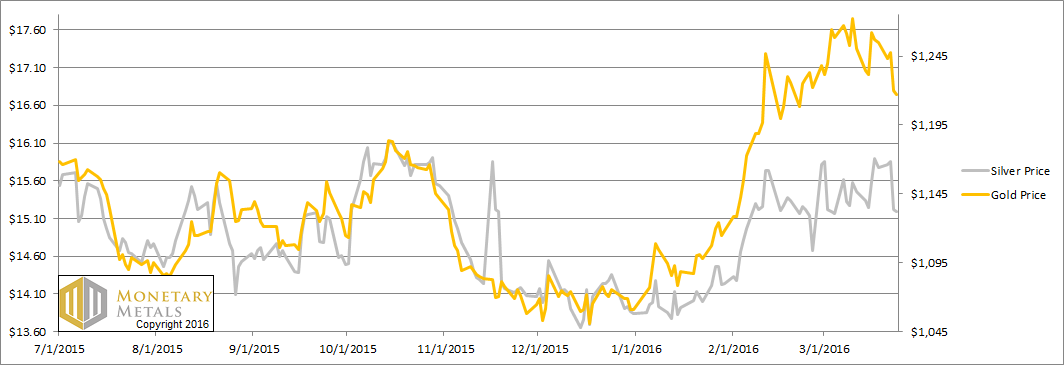
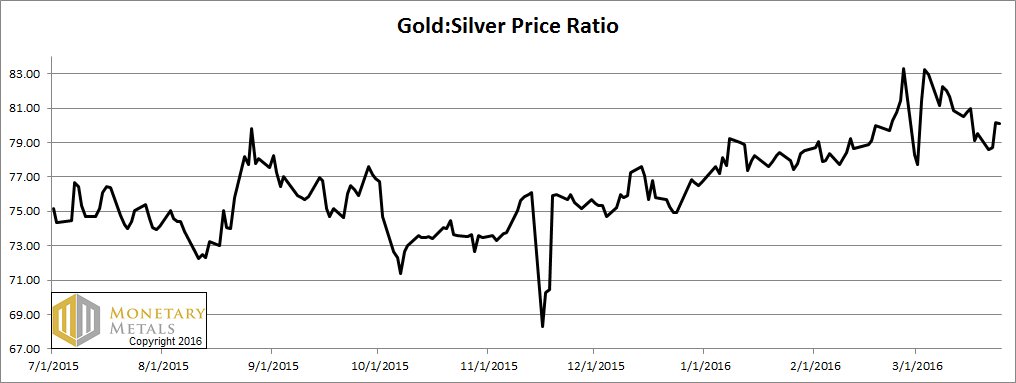
Gold went down (as the muggles would measure it, in dollars). It dropped almost 40 bucks. Silver fell almost 60 cents. Since silver fell proportionally farther than gold, the gold-silver ratio went up.
Why do we keep reiterating that gold goes nowhere, that it’s the dollar which mostly goes down over long periods of time and sometimes up as in 2011-2015? Why do we insist that the dollar be measured in gold, and that gold cannot be measured in dollars the way a steel meter stick cannot be measured in rubber bands?
Some ideas that are impossible to understand using the dollar paradigm. For example, gold is in the process of withdrawing its bid on the dollar. This will have devastating consequences, which the word “reset” does not begin suggest. If the dollar is money, then this assertion — gold bids on the dollar — is incomprehensible. However, if gold is money then that makes the dollar just the irredeemable scrip issued by the Fed in order to finance its purchase of Treasury bonds. Who would be eager to trade his money to buy such scrip?
Another example is that the gold-silver ratio (or gold-oil ratio or gold-Dow ratio) are just prices. If the dollar is money, it makes sense to look at the ratio of various prices in the market. Readers often ask if the gold-platinum ratio is signaling a buy.
Well, if gold is money, then there is just a price of platinum. Is a cheap price of platinum necessarily a signal to buy? It could be a good speculation, or it could be that there’s a reason why this industrial metal is cheap.
Gold is not just a commodity. It does not go up and down. It is the closest thing that economics has to a constant. A wheel may not be perfectly round if you zoom in under an electron microscope, but it’s the best way to roll your car to work. Gold may not be perfectly constant, but it’s the best way to measure wealth, prices, and the value of all assets.
To say gold is money is a paradigm shift. It’s easy to say. It’s (relatively) easy to show. But it’s really hard to wrap your head around. Why? Because it goes against everything we’re taught.
Fundamental Developments
This was a shortened week, due to Easter. Nevertheless, something happened to the fundamentals this week. Read on for the only true picture of the gold and silver supply and demand fundamentals.
But first, here’s the graph of the metals’ prices.

Next, this is a graph of the gold price measured in silver, otherwise known as the gold to silver ratio. The ratio was up this week.
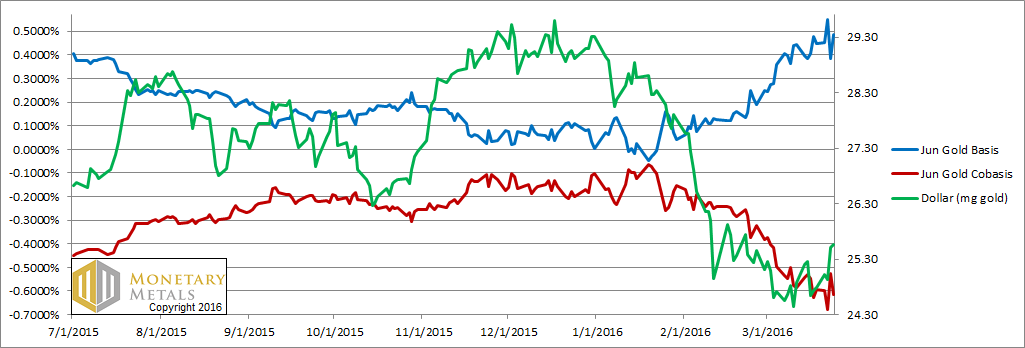
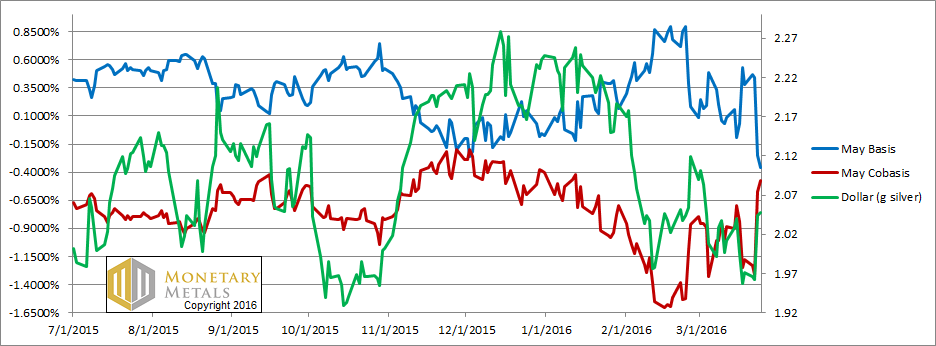
For each metal, we will look at a graph of the basis and cobasis overlaid with the price of the dollar in terms of the respective metal. It will make it easier to provide brief commentary. The dollar will be represented in green, the basis in blue and co-basis in red.
Here is the gold graph.
NB: we switched from the April to the June gold contract, as the former is approaching expiry.
The green line is the price of the dollar, measured in gold terms (i.e. the inverse of the price of gold). The red line is the gold co-basis, our measure of scarcity of the metal. For many weeks, as it fell (i.e. the gold price rose) gold became less scarce. And when it rose, gold became more scarce. There was an almost uncanny tracking of these two lines (which is less pronounced in the June contract).
That relationship deviated this week. Our scarcity indicator is near its lows for the move, but the dollar is up more than a milligram (4.5%) since March 10, yet gold has become less scarce since then.
Gold metal has come to market. It has pushed the price of the metal down, and its abundance up. Our calculated fundamental price of gold is now a hair under $1,300.
Now let’s look at silver.
Silver moved different than gold this week. Whereas in gold, the red co-basis line diverged from the green dollar line, in silver they continue to track. That is, the metal becomes less scarce at higher prices and more scarce at lower prices.
Look at the big rise in the dollar (drop in the price of silver) on Wednesday, and at the same time the co-basis rises. On Thursday, there was a smaller drop in the price of silver and a further increase in scarcity.
The silver fundamental price did slide further this week, even so. It is now about a dollar under the market price.
Monetary Metals will be in Hong Kong for Mines and Money, and in Singapore for Mining Investment Asia. If you will be in town for either conference, and would like to meet, please drop us a line.


