
Everything good comes to an end sooner or later, and no ascent lasts forever as Icarus would confirm. That could very well apply to the current situation around precious metals.
Speaking of indications pointing to the situation being excessive, let’s take a look at the USD Index.
Remember when in early 2018 we wrote that the USD Index was bottoming due to a very powerful combination of support levels? Practically nobody wanted to read that as everyone “knew” that the USD Index was going to fall below 80. We were notified that people were hating on us in some blog comments for disclosing our opinion – that the USD Index was bottoming, and gold was topping. People were very unhappy with us writing that day after day, even though the USD Index refused to soar, and gold was not declining.
Well, it’s the same right now.
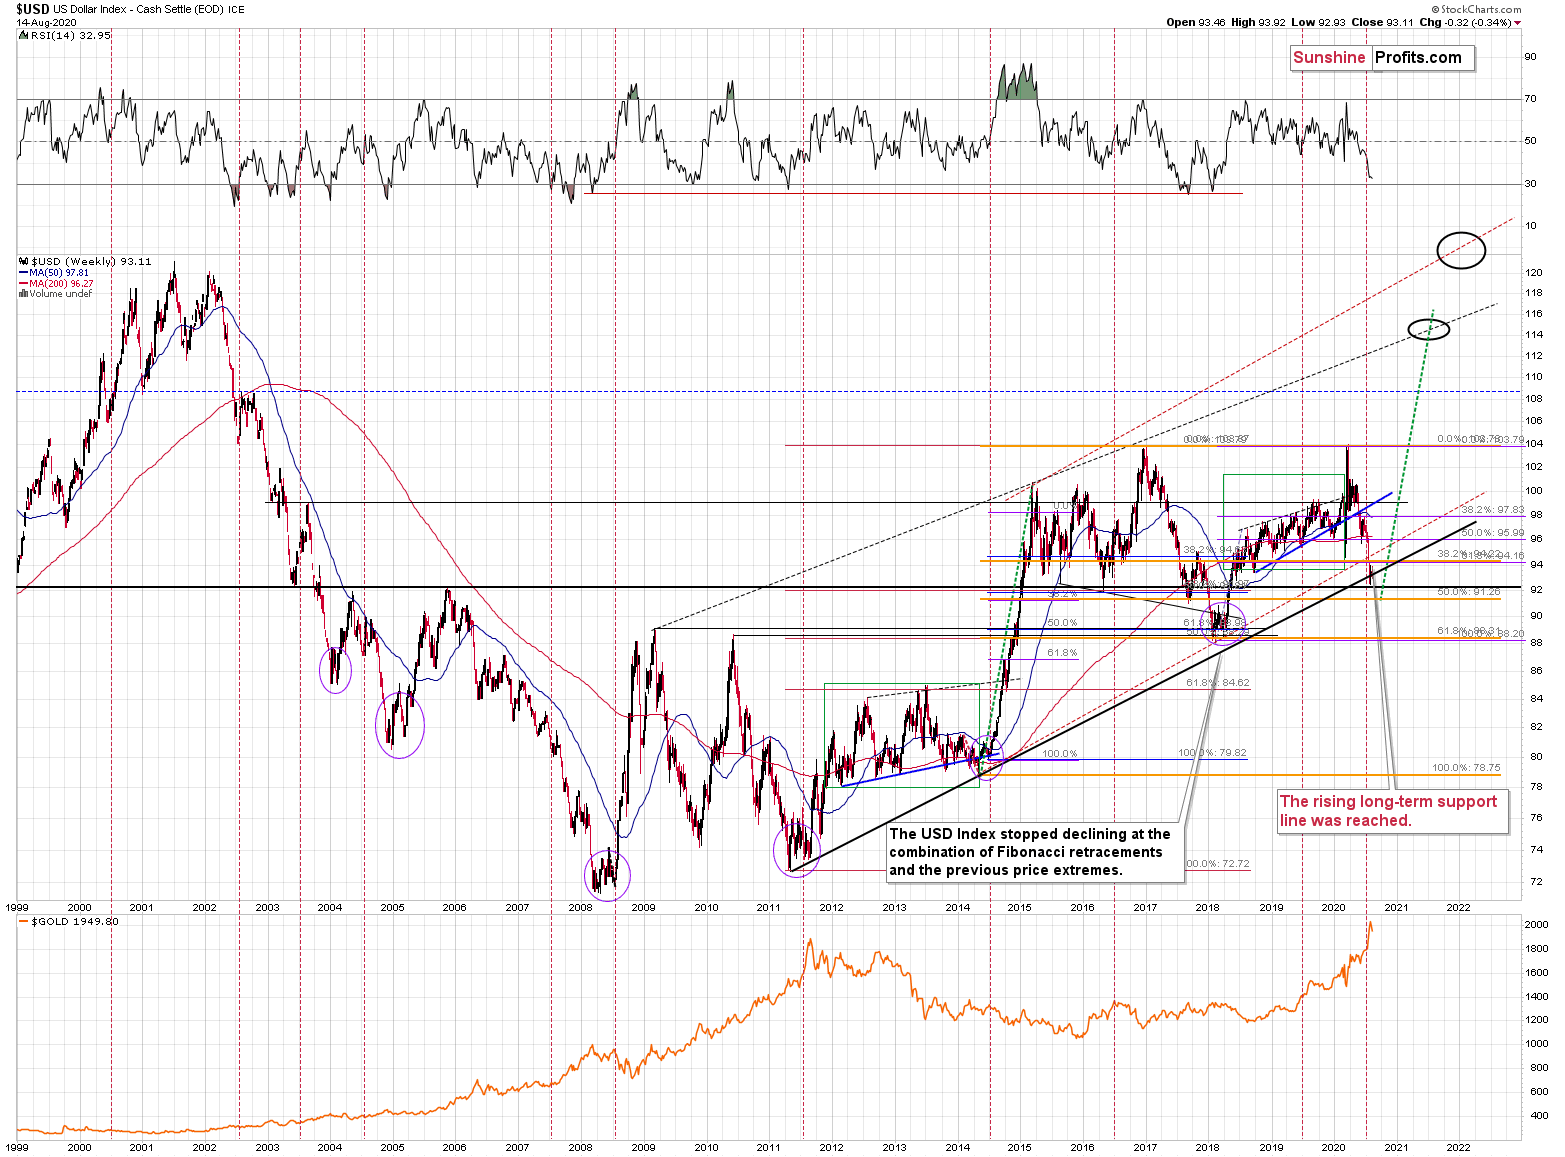
The USD Index is at a powerful combination of support levels. One of them is the rising long-term black support line that’s based on the 2011 and 2014 bottoms.
The other major long-term factor is the proximity to the 92 level – that’s when gold topped in 2004, 2005 and where it – approximately – bottomed in 2015, and 2016.
The USDX just moved to these profound support levels, and it’s very oversold on a short-term basis. It all happened in the middle of the year, which is when the USDX formed major bottoms on many occasions. This makes a short-term rally here very likely.
While it might not be visible at the first sight, the USD Index moved briefly below the long-term black support line and then it invalidated this breakdown before the end of the previous week. This is a very bullish indication for the next few weeks.
We even saw a confirmation from USD’s short-term chart.
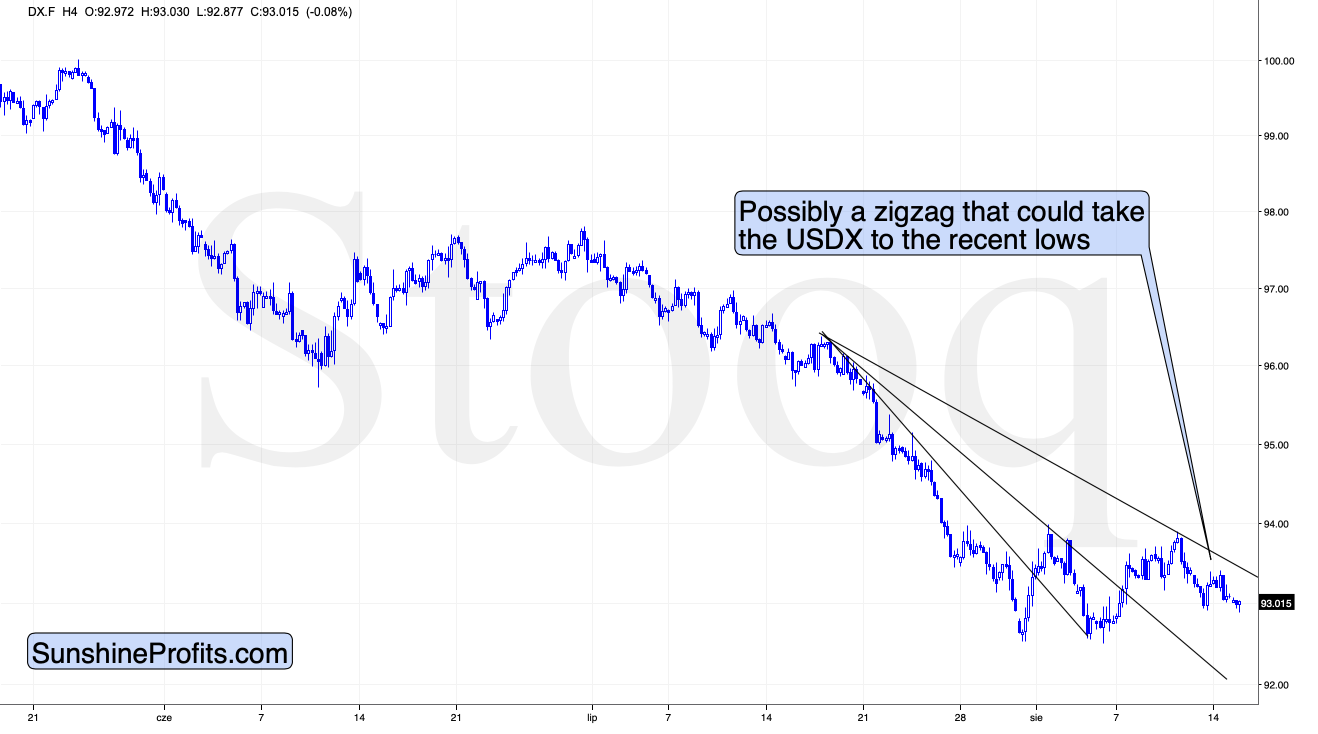
The U.S. currency is finally after a decisive short-term breakout. In fact, it’s already after two short-term breakouts. Looking at the short-term picture only, the USD’s sideways trading could be both: a triple-bottom pattern, or a flag consolidation pattern. The former would be bullish, and the latter would be bearish. Based on the previous long-term chart, the bullish interpretation is stronger.
Back in March, the short-term breakout in the USD Index was the thing that triggered the powerful rally in it, as well as a powerful plunge in the precious metals market. It’s generally a good gold trading tip to monitor the USD Index’s performance.
Consequently, based on this analogy, the implications for the near term are bearish for the precious metals. Especially, when we consider the fact that Direxion Daily Gold Miners Index Bull 2X Shares (NYSE:NUGT) showed the highest possible overbought reading recently.
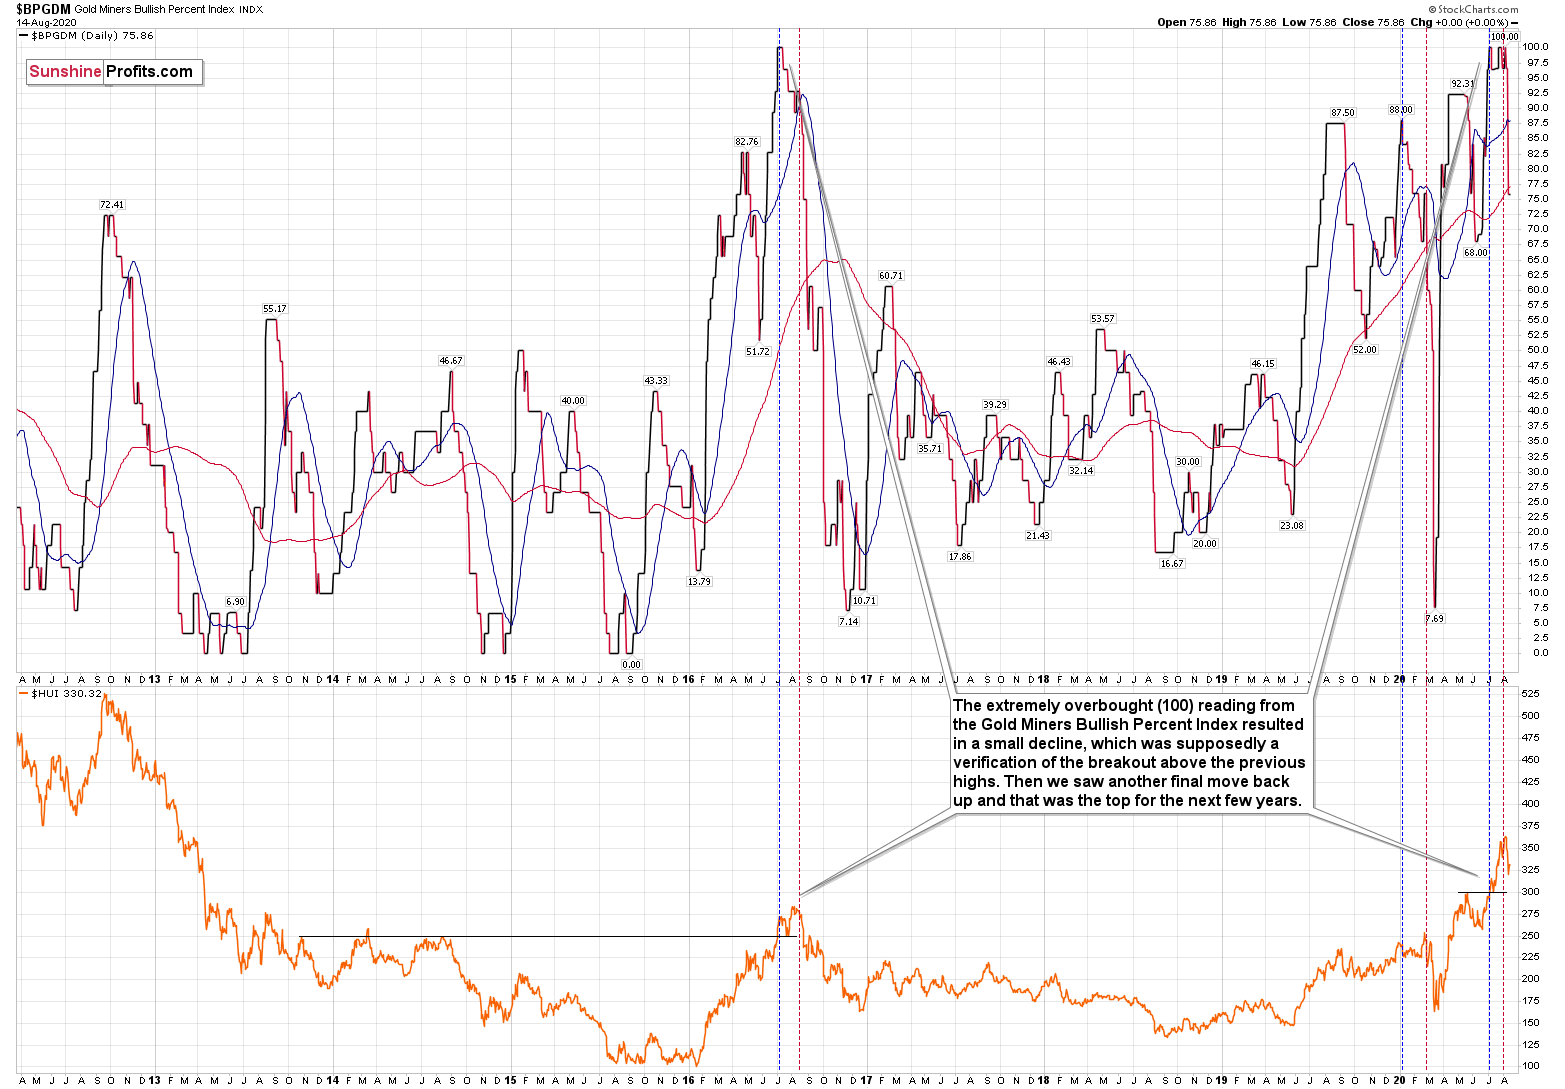
The excessive bullishness was present at the 2016 top as well and it didn’t cause the situation to be any less bearish in reality. All markets periodically get ahead of themselves regardless of how bullish the long-term outlook really is. Then, they correct. If the upswing was significant, the correction is also quite often significant.
Please note that back in 2016, there was an additional quick upswing before the slide and this additional upswing has caused the Gold Miners Bullish Percent Index to move up once again for a few days. It then declined once again. We saw something similar also this time. In this case, this move up took the index once again to the 100 level, while in 2016 this wasn’t the case. But still, the similarity remains present.
Back in 2016, when we saw this phenomenon, it was already after the top, and right before the big decline. Given the situation in the USD Index, it seems that we’re seeing the same thing also this time.
Please note that back in 2016, after the top, the buying opportunity didn’t present itself until the Gold Miners Bullish Percent Index was below 10. It’s currently above 70, so it seems that miners have a long way to go before they bottom.
Gold stocks declined significantly last week, after which they paused. Their performance is weaker than it was in early March, but this can be explained by smaller size of gold’s rebound.
Back in March, gold moved back to its previous highs (in fact, it moved slightly above it) before topping and right now, it’s consolidating lower. Still, we should keep in mind that there’s also the possibility that gold won’t repeat the March performance to the letter and history will rhyme instead.
Consequently, it might be more useful to monitor the market for signs of weakness and to pay extra attention to the time factor.
After all, time is more important than price; when the time is right, the price will reverse.
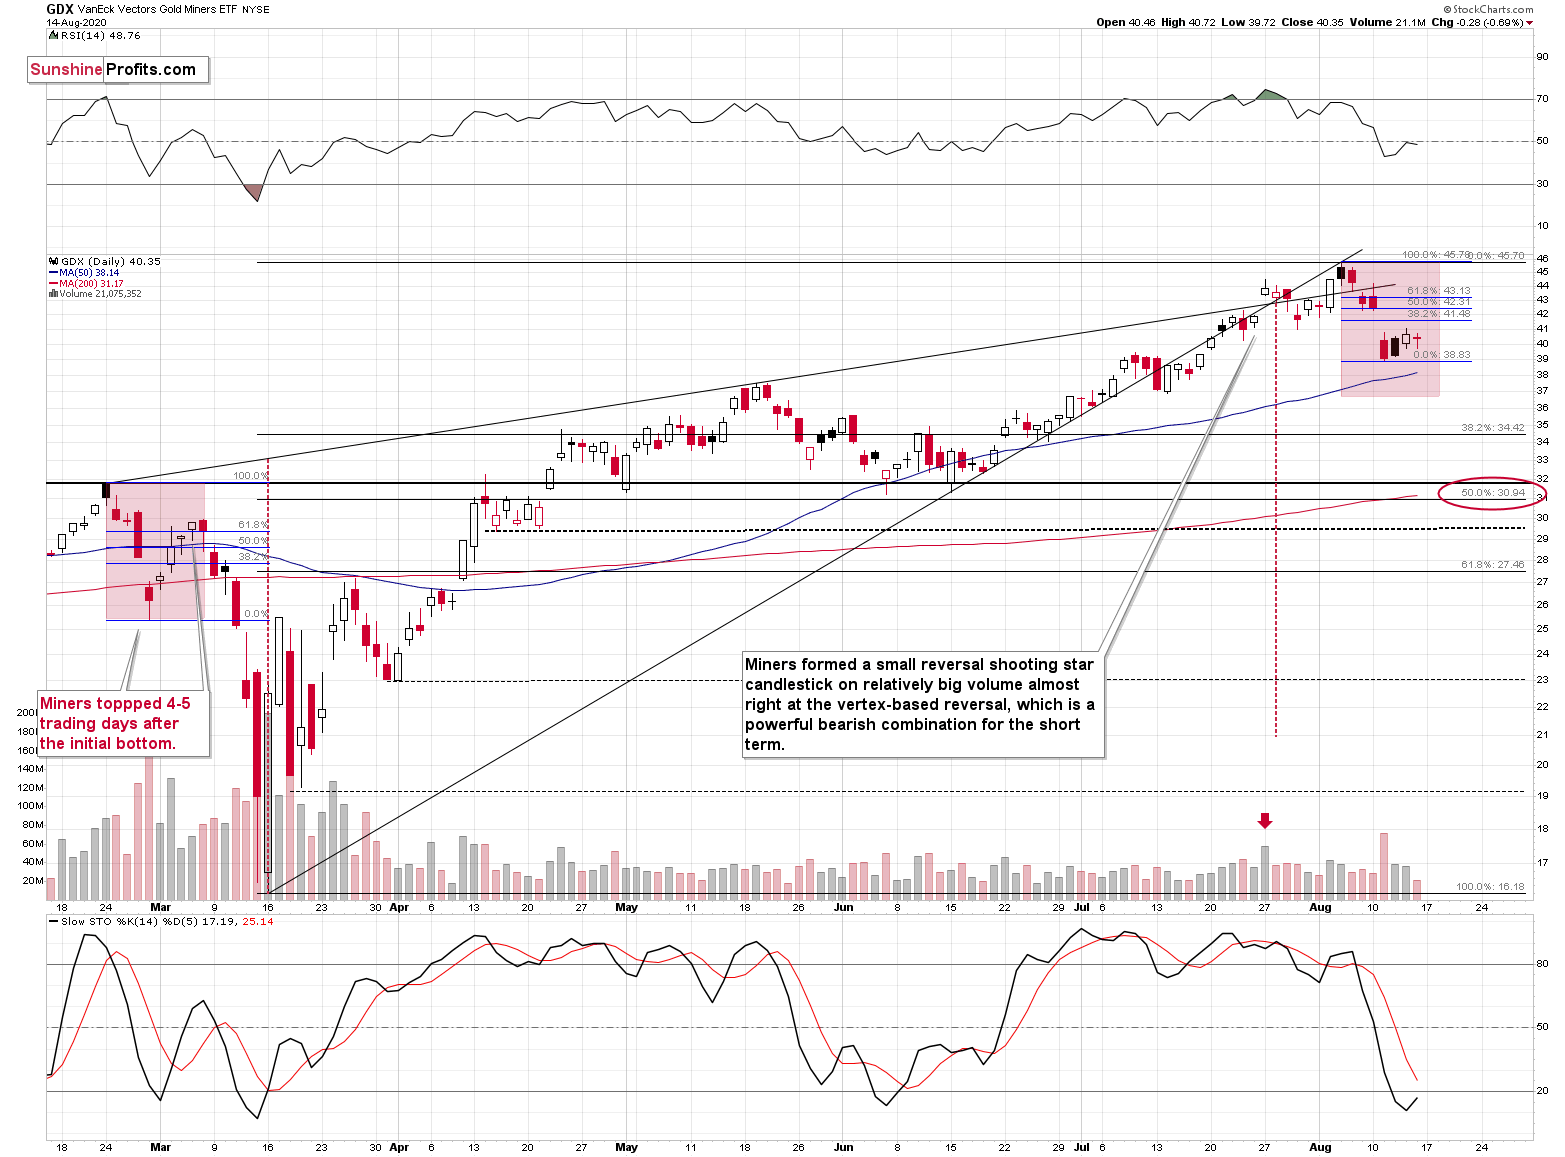
Back in February, it took four days after the top for the miners to form their initial bottom, and we saw the same thing this time.
Back then, it then took four (closing prices) or five (intraday extremes) trading days for the miners to top. Today will be the fourth trading day after the bottom, So if the history is to repeat itself with regard to time, miners might form the final top today or tomorrow. This would be in tune with where the general stock market is trading right now. It’s so close to its previous high that it could easily break to new highs and then invalidate this breakout today or tomorrow.
If gold does indeed rally to the previous highs or even moves slightly above them, we don’t expect miners to do the same thing. In fact, we think that they would be likely to top close to the 61.8% Fibonacci retracement level (at most) – at about $43.
The downside target for the mining stocks is very far from the current price. However, if the stock market declines significantly once again, miners can indeed fall far, even if gold declines by “only” a couple of hundreds of dollars.
We marked also an interim price target that’s based on a few other techniques, with a red ellipse – at about $31-$32. One of the techniques is the 50% Fibonacci retracement level based on the March-August rally, and the other two are the February high, and the May and June lows. That’s also where – approximately – we have the 200-day moving average. The latter is not particularly strong in case of the GDX ETF (NYSE:GDX), so we wouldn’t say that it creates any significant support on its own, but it serves as a good confirmation of the other techniques.