
Realty Income Corporation’s (NYSE:O) second-quarter 2019 adjusted funds from operations (FFO) per share of 82 cents surpassed the Zacks Consensus Estimate of 81 cents. The reported figure is also up 2.5% from the prior-year quarter’s reported tally of 80 cents.
The company benefited from year-over-year growth in revenues as well as recorded modest same-store rent growth. It maintained its guidance for full-year 2019.
Total revenues for the reported quarter came in at $365.4 million, up 11.1% year over year. The revenue figure also exceeded the Zacks Consensus Estimate of $360.9 million.
Quarter in Detail
During second-quarter 2019, same-store rents on 4,863 properties under lease inched up 1.4% to $294 million from the prior-year quarter. Portfolio occupancy of 98.3% as of Jun 30, 2019, shrunk 40 basis points (bps) year over year and remained flat sequentially.
Further, the company had 102 properties available for lease, out of a total of 5,951 properties in the portfolio as of Jun 30, 2019, compared with 102 properties as of Mar 31, 2019. Additionally, during the quarter, the company re-leased 82 properties to existing and new tenants, at a rent recapture rate of 100.4 %.
Portfolio Activity
During the second quarter, Realty Income invested $1.1 billion in 102 properties bringing the company total year-to-date investments to more than $1.6 billion. This includes £433.9 million (or nearly $549.2 million) of the company’s first international real estate investment in the U.K.
The assets are under long-term, net lease agreements, with a weighted average lease term of around 9.4 years, and an initial average cash lease yield of 6.1%. Around 12% of the rental revenues from acquisitions reported during the quarter came in from investment grade-rated tenants and their subsidiaries.
The company sold 18 properties for $22.5 million, with a gain on sales of $6.9 million, during the April-June period.
Liquidity
Finally, Realty Income exited second-quarter 2019 with cash and cash equivalents of $27.1 million, up from $10.4 million at the end of 2018. Furthermore, Realty Income raised $1 billion from the sale of common stock, at a weighted average price of $69.67 per share, during the reported quarter.
Further, the company has a $3.25-billion unsecured credit facility, comprising a $3-billion revolving credit facility and a $250-million term loan. As of Jun 30, 2019, the company had a borrowing capacity of $8 million available on its revolving credit facility.
Outlook
Realty Income expects full-year 2019 adjusted FFO per share of $3.28-$3.33. The Zacks Consensus Estimate for the same is currently pegged at $3.29.
Our Take
Realty Income’s decent second-quarter performance is impressive. In fact, continuing with its focus on external growth through accretive acquisitions, the company invested roughly $1.1 billion in high-quality properties in the June-end quarter. With this, the company’s investments aggregated to $1.6 billion in first-half 2019. These investments will likely drive the company’s growth.
Nonetheless, the retail apocalypse will likely be a hurdle for the company. Furthermore, with substantial single-tenant assets in its portfolio, the company is considerably exposed to risks of tenant default that can result in loss of revenues.
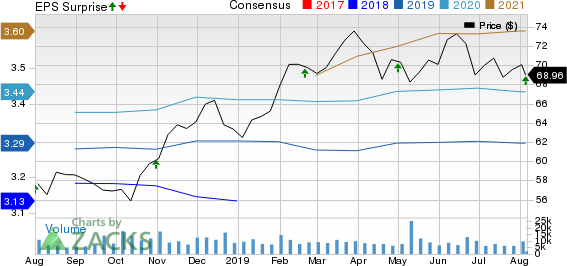
Realty Income Corporation Price, Consensus and EPS Surprise
Realty Income currently carries a Zacks Rank #3 (Hold). You can see the complete list of today’s Zacks #1 Rank (Strong Buy) stocks here.
Performance of Other REITs
Kimco Realty Corp.’s (NYSE:KIM) second-quarter 2019 FFO as adjusted came in at 36 cents per share, in line with the Zacks Consensus Estimate. The reported tally came in a penny less than the year-ago quarter’s FFO as adjusted of 37 cents per share.
Taubman Centers Inc. (NYSE:TCO) reported second-quarter adjusted FFO per share of 94 cents, beating the Zacks Consensus Estimate of 83 cents. The figure also compared favorably with the year-ago quarter’s reported tally of 87 cents.
Simon Property Group, Inc.’s (NYSE:SPG) second-quarter FFO per share of $2.99 per share exceeded the Zacks Consensus Estimate by a whisker. The FFO per share figure also surpassed the year-ago quarter’s reported tally of $2.98.
Note: Anything related to earnings presented in this write-up represent funds from operations (FFO) — a widely used metric to gauge the performance of REITs.
The Hottest Tech Mega-Trend of All
Last year, it generated $8 billion in global revenues. By 2020, it's predicted to blast through the roof to $47 billion. Famed investor Mark Cuban says it will produce "the world's first trillionaires," but that should still leave plenty of money for regular investors who make the right trades early.
See Zacks' 3 Best Stocks to Play This Trend >>
Taubman Centers, Inc. (TCO): Free Stock Analysis Report
Kimco Realty Corporation (KIM): Free Stock Analysis Report
Simon Property Group, Inc. (SPG): Free Stock Analysis Report
Realty Income Corporation (O): Free Stock Analysis Report
Original post
Zacks Investment Research