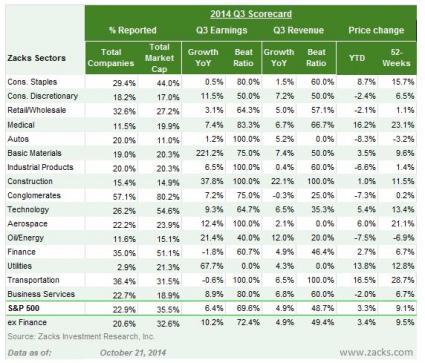
Including all of yesterday’s results, we now have Q3 results from 115 S&P 500 members that combined account for 35.5% of the index’s total market capitalization. Total earnings for these 115 companies are up +6.4% from the period last year, with 69.6% beating earnings estimates. Total revenues for these companies are up a much stronger +4.9%, with 48.7% beating top-line estimates.
Here is the updated scorecard for the 115 S&P 500 companies that have reported results; we include results that came after the close yesterday (October 21, 2014):

How Do These Results Compare Historically?
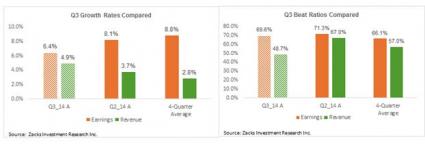
The charts below compare the earnings and revenue growth rates for the 115 S&P 500 members that have reported results with what we saw from the same group of companies in 2014 Q2 and the average for the preceding four quarters (though Q2).

Looking at the above comparison charts, three things stand out:
- The earnings growth rate is lower,
- The revenue growth rate is higher, and the
- Beat ratios are below Q2 levels, but roughly in-line with historical levels.
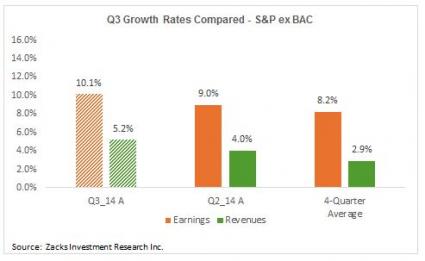
The unfavorable earnings growth comparison is solely due to Bank of America (Bank of America Corporation (NYSE:BAC); the picture looks a lot better once BofA is excluded from the data. The chart below reproduces the above growth comparison chart, but excludes Bank of America from the reported results

The bottom line from this analysis is that Q3 results are broadly in-line with what we have been seeing in other recent quarters, though the growth pace appears to have improved a bit at this stage.
Sector Results – Tech Weakness Stands Out
Four sectors -- Conglomerates, Technology, Finance and Finance -- have the most earnings reports at this stage. Please look at the second column in the scorecard table that shows the percentage market cap of each sector that has reported results.
For the Finance sector, the largest earnings contributor to the S&P 500 index, total earnings for the 28 sector companies that have reported results already (out of 80 total) are down -1.8% on +4.9% higher revenues, with 60.7% of the companies beating EPS estimates and 46.4% coming ahead of top-line estimates.
As mentioned earlier, Bank of America was a drag on the sector’s growth picture; the growth rate looks better once BAC is excluded from the sector’s results. That said, the sector’s beat ratios are the weakest not only relative to what we have been seeing from the sector in other recent periods, but also relative to the broader market.
Results from the all-important Technology sector are on the weak side, with both growth rates and beat ratios tracking below levels that we become used to seeing from the sector. With results from more than half of the sector’s market cap already out, the results thus far are fairly representative of the sector as whole.
Total earnings for the 54.6% of the Tech sector’s market cap that has reported Q3 results are up +9.3% on +6.5% higher revenues, with 64.7% beating on earnings and a very low 35.3% coming ahead of top-line estimates.
Thus far, Apple’s (NASDAQ:AAPL) strong report seems to be an outlier in the group, though admittedly Intel’s (NASDAQ:INTC) results were good enough as well. IBM’s (IBM) problems may be company specific, but its comment about the weak September essentially confirmed what we had heard from Microchip (NASDAQ:MCHP) a few days earlier.
The charts below compare the Tech sector’s results thus far with what we have seen from the sector in other recent quarters.

The Composite Q3 Picture
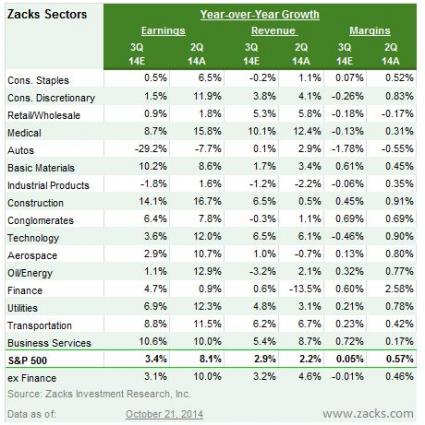
Looking at Q3 expectations as a whole, combining the actual results from the 115 S&P 500 members that have reported with estimates for the remaining 385, total earnings are expected to be up +3.4% on +2.9% higher revenues. The composite growth has started going up as more companies report and beat estimates.
The table below provides a summary view of composite Q3 expectations and compares them to actual results in Q2.

