I did an update on Precious Metals only a week ago and since then we’ve had a lot more selling. While I remain fully hedged in Silver and also continue to hold my naked short positions in Gold, I believe that any further downside from the current levels will eventually see us reach extremely oversold conditions from which a major rally should occur. In the coming weeks or months, depending on how long the selling exhaustion lasts, we could be approaching an all important buying opportunity.
Please understand that during the last leg of the bear market (I believe that is where we are), liquidation can last for a while. I happen to think that the majority of the sector will be under pressure until Gold re-tests its pschological level of $1000 per ounce (give or take some dollars). However, this isn’t necessarily a prediction as I acknowledge that a low could now come at anytime as we are becoming very oversold. More and more indicators are flashing buy. Let us go through some of these extreme indicators:
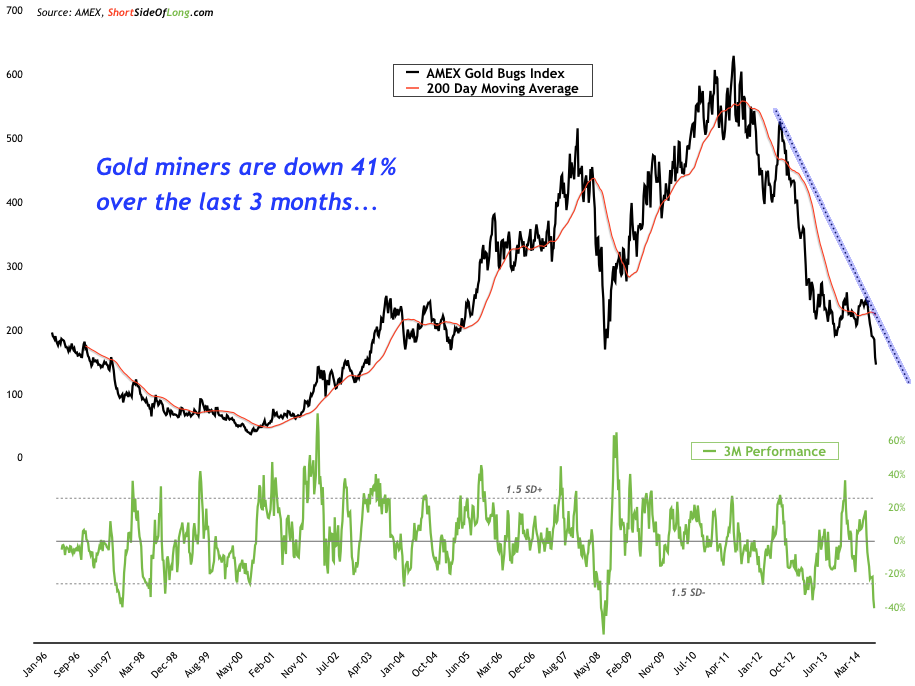
Chart 1: Gold miners are oversold and have fallen 41% the last 3 months
Prices of various assets within the Precious Metal sector have gone down a lot over the last rolling quarter or 3 month period. Consider the chart above, which shows extremely oversold conditions in Gold Mining shares, which are currently down 41% over the last 90 days. This is an astoundingly large drawdown, second only to the Global Financial Crisis of 2008.
In the same period, Gold is down almost 13%, Silver is down almost 22%, Platinum is down over 17%, Silver Miners are also down over 41%, Gold Mining Juniors are down a whopping 46% and Silver Mining Juniors are down close to 45% in just three months. As already stated, these are some insane losses in a very short period of time, especially considering the bear market is over 3 years old!
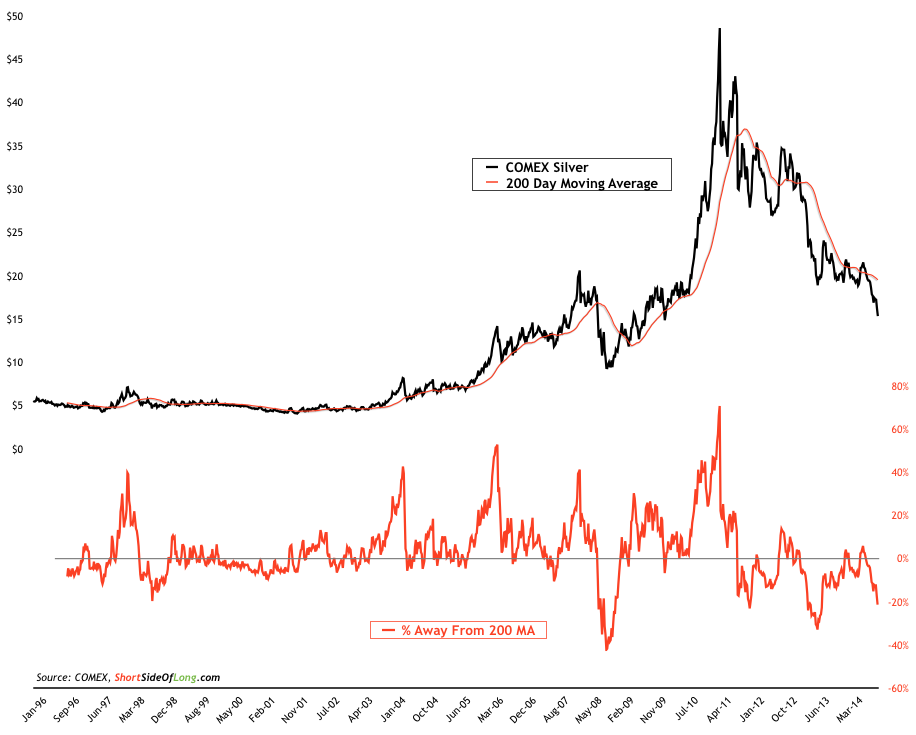
Chart 2: Silver price is more then 20% below its 200 day moving average
With prices so oversold, it shouldn’t be a surprise that indicators such as the one in Chart 2 are once again showing extreme readings. Sure, they’ve been even more extreme still, but when an asset is more then 20% below its 20 day moving average, like Silver is today, you should pay attention. It might go down to 30% by next week, but my point here is that a rebound and a mean reversion is in the cards very soon indeed.
Also consider the fact that Gold is trading 10% below its 200 day MA, which is quite a rare event. I think it has happened only 8 or so times over the last 25 years. Gold Miners find themselves more then 32% below their long term MAs. Finally, Gold Mining Juniors are in total panic mode, as they trade almost 40% below the 200 day MA and over 27% below their shorter term 50 day MA. This is just getting ridiculously oversold now…
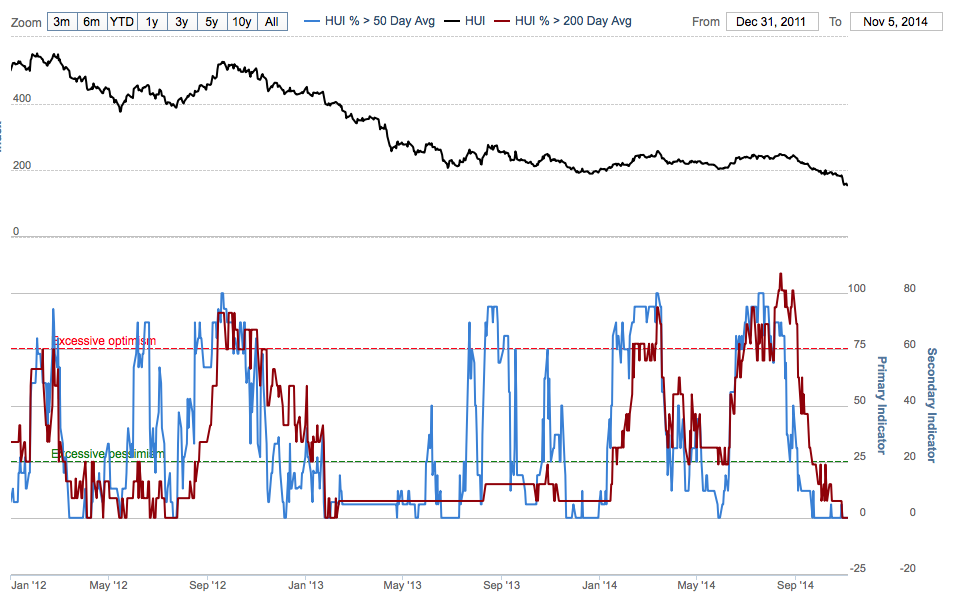
Chart 3: There are now 0% of Gold Miners trading above 50 & 200 MA
One thing is clear here. Gold Mining shares, whether they are large caps or small caps, have been beaten down…no, I think I should really say they have been smashed and bashed. This is also reflected in breath readings. 0% of companies within the ARCA Gold BUGS HUI Index are currently trading above the 50 day or 200 day moving averages.
But oversold breadth readings don’t stop there. A handful of days ago 88% of the index were making 52 week lows, one of the highest indications of total liquidations since April 2013, as the whole sector was in free-fall. Also of note, the Bullish Percent Index is at a reading of 0%. This occurred once during the 2008 crash and three times during 2013.
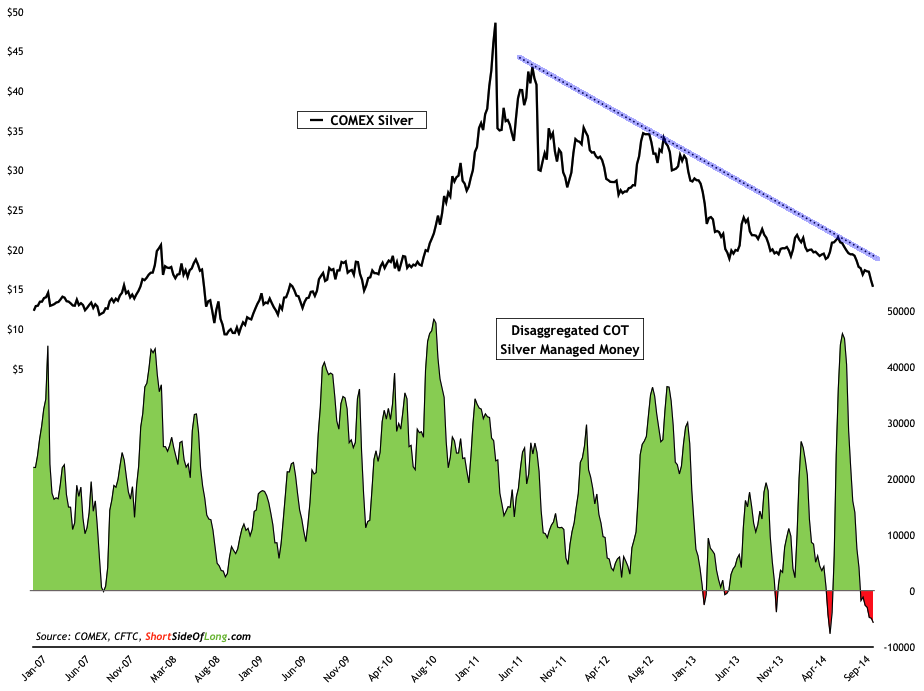
Chart 4: Hedge funds and other speculators are now heavily short Silver
As we wait for the this week's release of the Commitment of Traders report, we can already assume that positioning is going from bad to worse. The bottom line is, a major shake-out is in progress. Hedge funds have already been heavily short Silver and that is most likely going to intensify further. At the same time, sentiment surveys are showing an extremely negative picture, with hardly anyone believing Silver will rise from here. Sentiment readings aren’t any better in Gold and Platinum, where prices have been dropping like a rock.
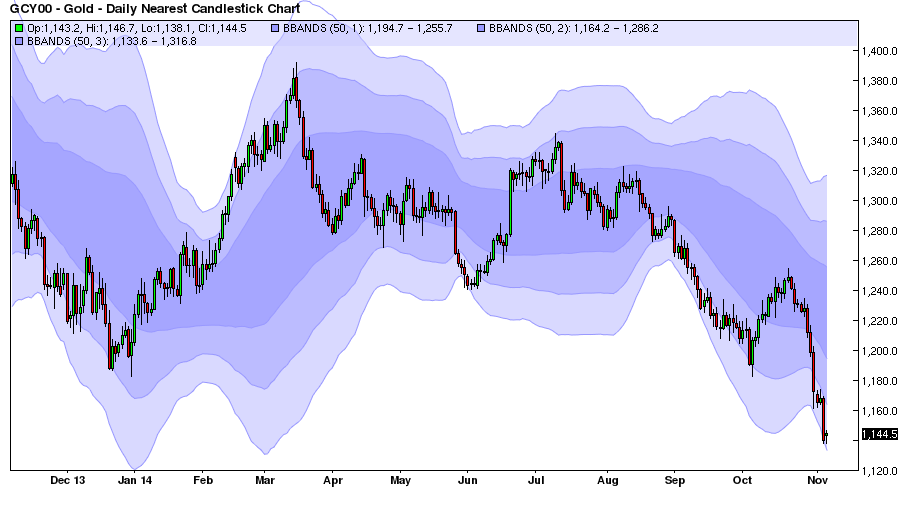
Finally, speaking of prices, Gold prices where trading more then 3 standard deviations away from its 50 day mean yesterday. This is a very rare event, especially when Bollinger® Bands are wide and should be considered an extremely oversold condition from which powerful rebounds and mean reversions tend to occur.
Chart 5: Gold price is trading 3 standard deviations away from its mean
Is this the bottom for Precious Metals like Gold and Silver? I do not think so, but I will say that we are getting quite close now. In other words, it should be matter of weeks or months instead of a matter of years. One thing for certain, this is not a time to be entering new short positions on these beaten down assets.
Precious Metals investors have watched as a bear market slaughtered just about all assets within the sector. Even Gold is now down 40% from its all-time highs. Regular readers will know that I thought that buying Gold at $1185 in 2013 was a very good entry.
I still hold that view today and as prices now sink even lower, towards $1000 per ounce, buying Gold has gone from a very good entry toward a great entry. The lower it goes over the coming weeks and months, the better your return will be in the coming years.

