Following what were effective “no comment” speeches from Yellen and Draghi at Jackson Hole, U.S. dollar bears had the green light to keep selling dollars. Combined with a potential stand-off between the White House and Congress over the Mexican Wall being tied to extending the debt limit, the street needed no more excuses to move back into precious metals.
Both gold and silver’s price action was constructive to finish the week, a trend that has continued in Asia today, with gold up 0.45% and silver up 0.65% as we head into the European session. Trading may be muted, however, as London is on holiday today. Gold has risen five dollars to 1296.50, trading through its 1296.00 resistance. Silver has risen 14 cents, trading at 17.1500 as we head into Europe.
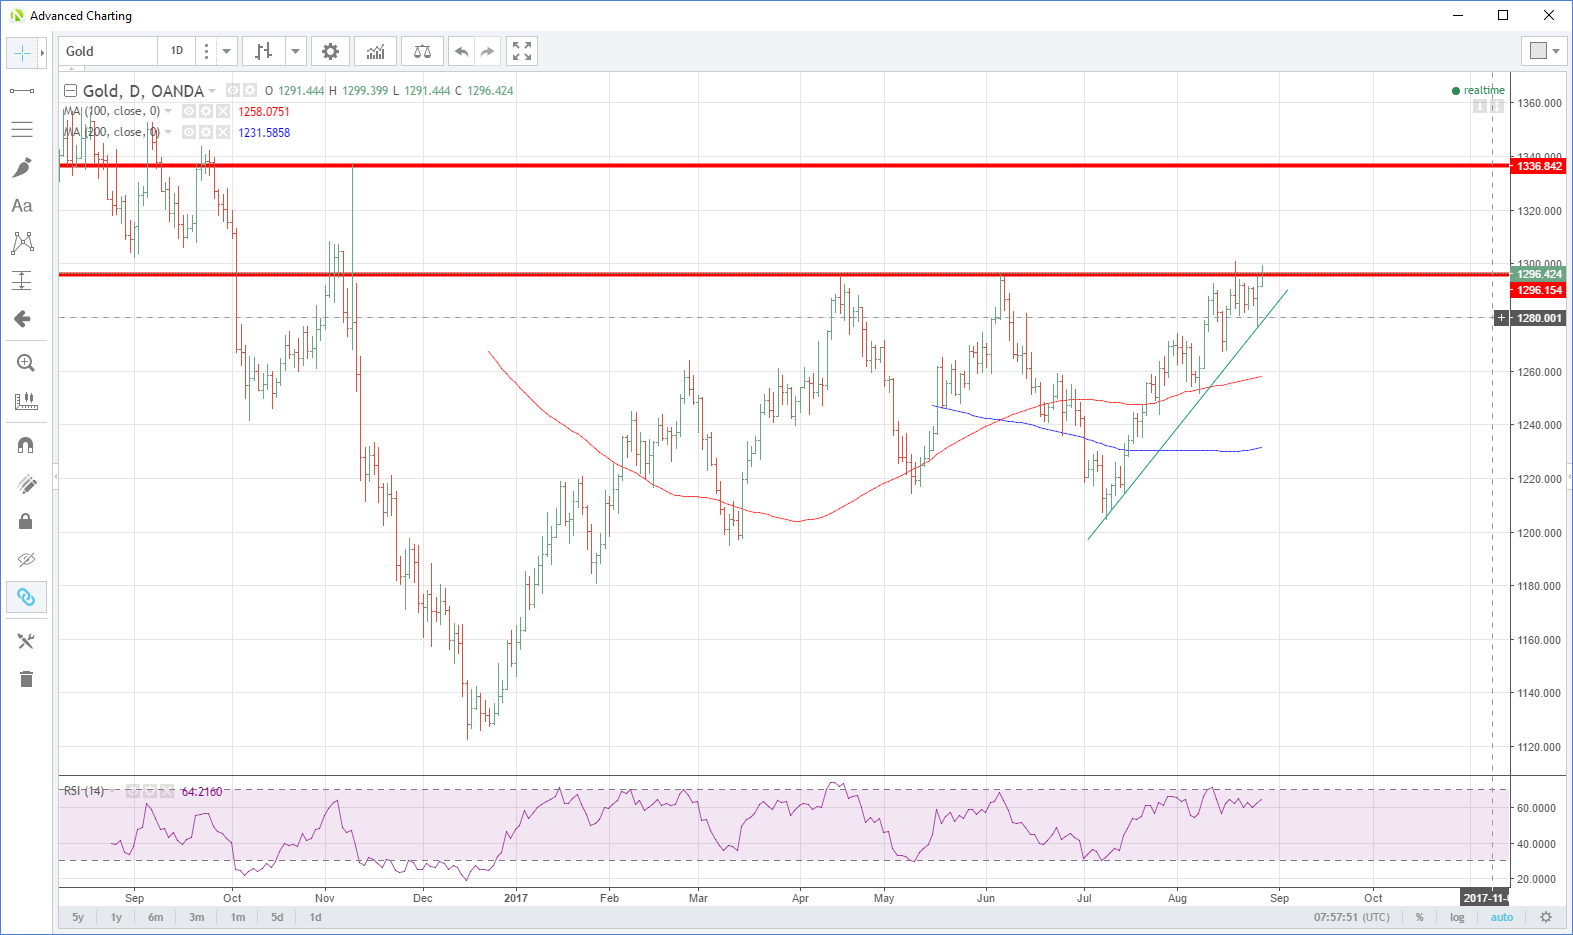
A break of 1296.00 is technically significant if we can close above here today. This opens up an attack on the 18th August spike high at 1301.00. A close above this level presents a lot of clear air on the chart with the next resistance being at 1337.50, the November 2016 high. A close above 1296.00 today would also imply we are seeing a breakout of the ascending wedge formation dating back to early July as per the chart below.
Support is at the ascending trend line, today being at 1279.00. Behind this level, next support is at 1267.50, the 15th August low and then the 100-day moving average at 1258.00.

Silver has underperformed relative to gold in August, having run into a brick wall above 17.2000 all month. I have attributed this to traders preferring to express their position in the more liquid gold contract, having been whipsawed and burnt by aggressive price action in silver this year, much like platinum.
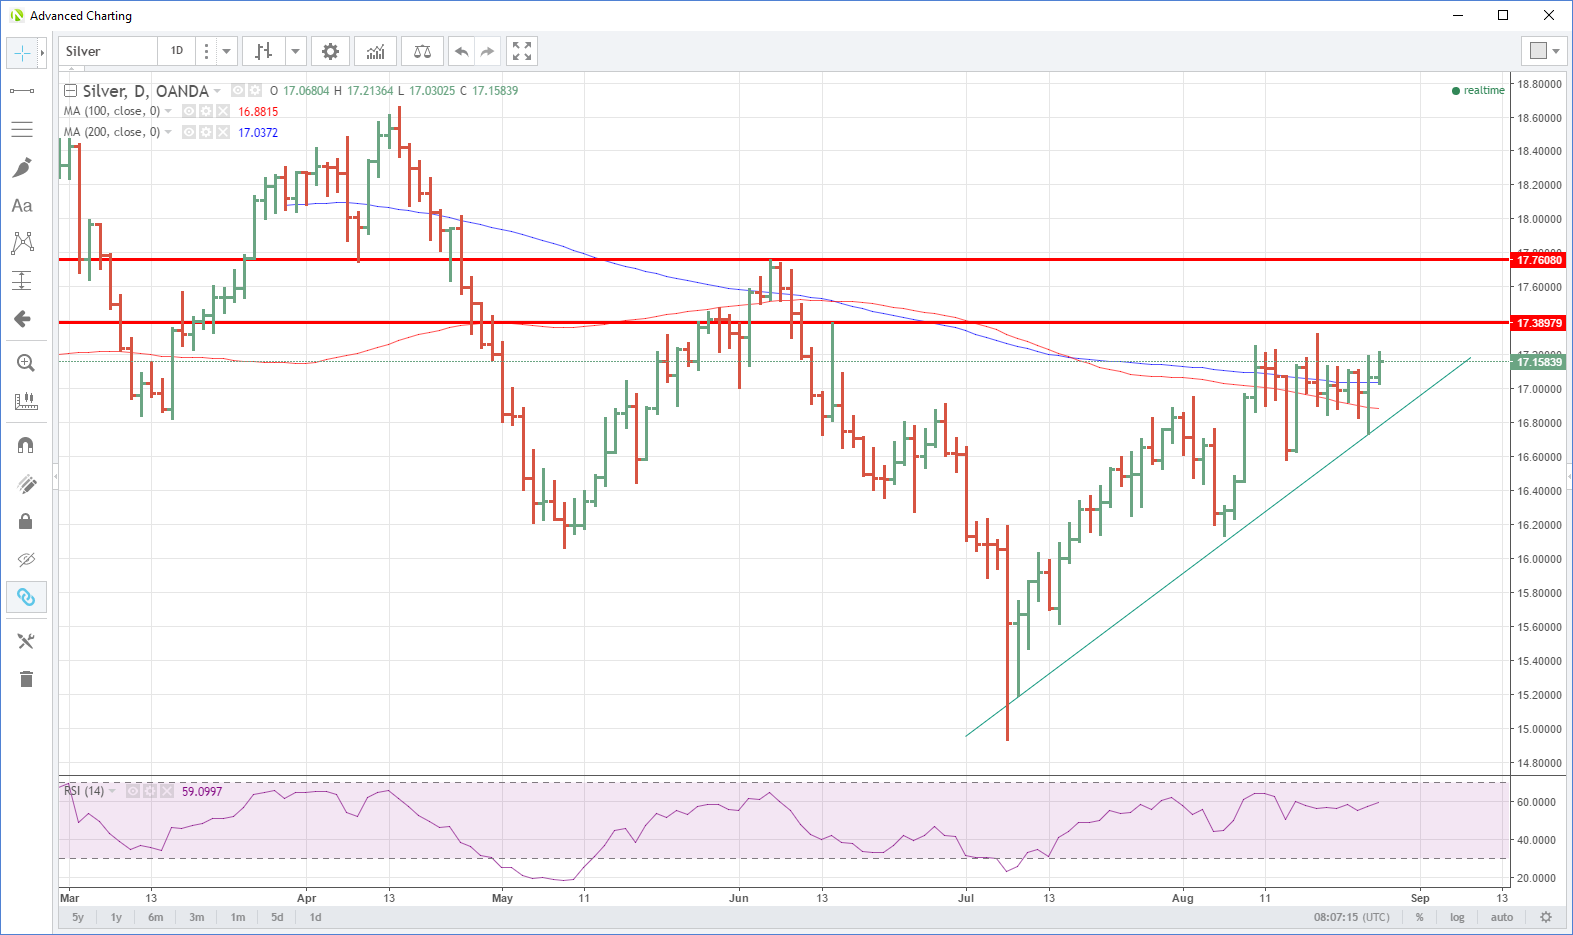
Having tested support at 16.7200 on Friday, silver produced a very nice rally to close just above its 200-day moving average at 17.0675. It appears to be consolidating those gains today.
Resistance will appear at the 17.3900 regions followed by the early June highs around 17.7600. A daily close above the latter is implying a test of 18.0000 awaits.
Silver has support at the 200-day average at 17.0375 followed by the rising support line, today at 16.7600. Only a break of the latter would jeopardise the bullish technical picture.
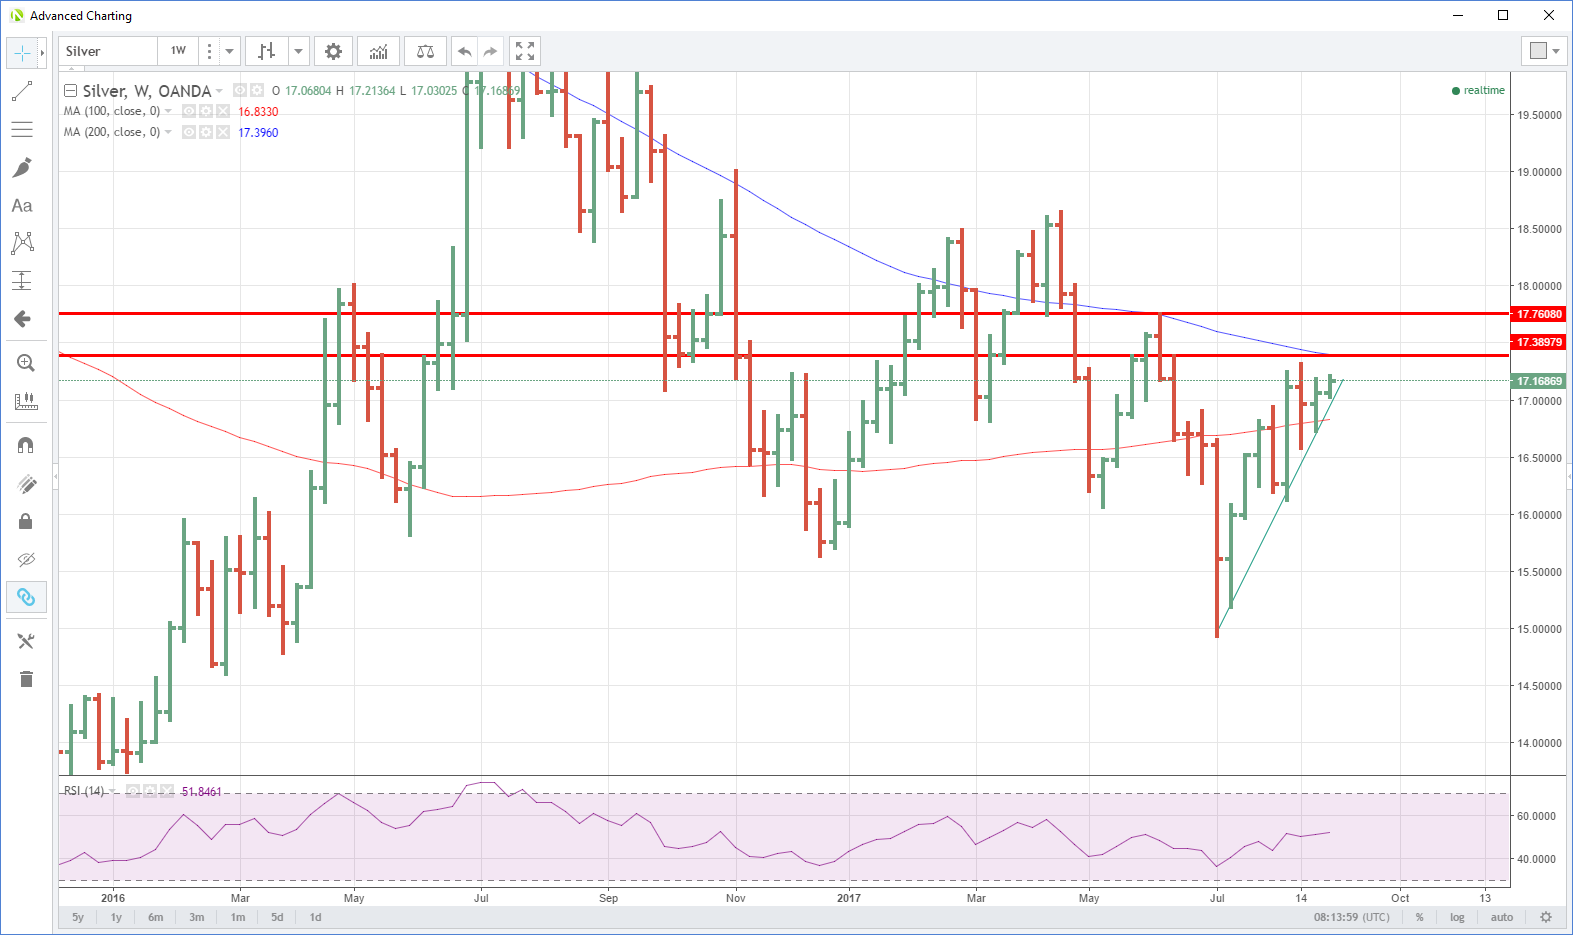
The silver weekly chart provides some interesting insight as well. With the previous rally topping at 17.7600 also being the 200-week moving average at the time. Today the average lies at 17.3960, very close to the daily resistance at 17.3900. Thus a break and close above the former would imply silver has chopped a lot of wood and could be set for a meaningful catch-up rally with gold.


