The stock market saw a bit of a sell off today as the FOMC statement and press conference took place. The entire statement can be read here but basically the Federal Reserve continues to stay the course of tapering it's bond buying program by another $10 billion a month but drops it's 6.5% unemployment rate threshold.
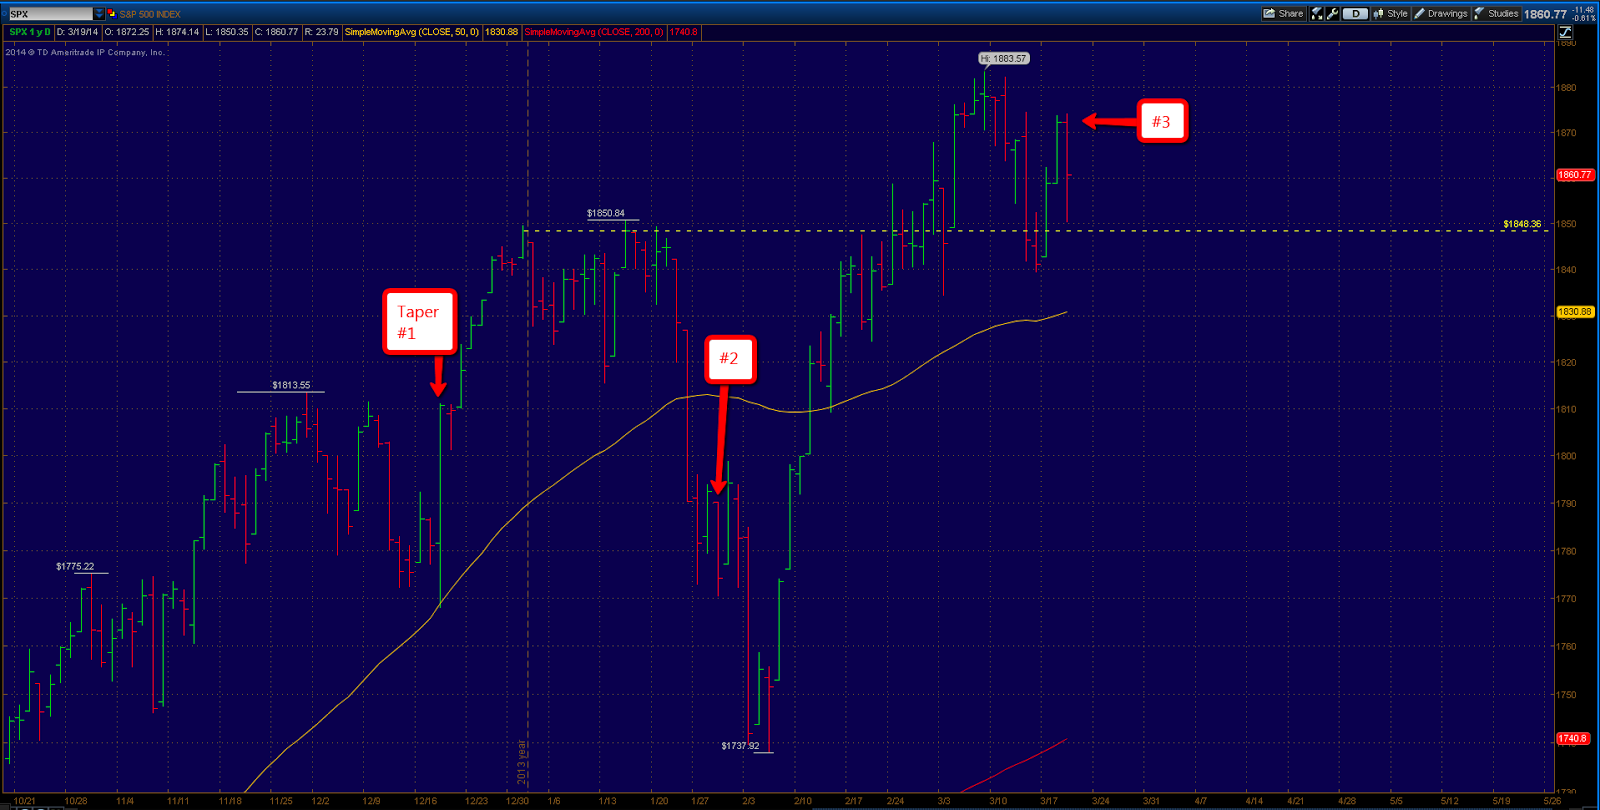
The S&P 500 chart above depicts how each of the three tapering statements has been digested. The initial announcement in December of 2013 saw the markets move substantially higher. The second announcement was not greeted as well as it kicked off a 60 point drop in the S&P.
Today's announcement traded more like the last. So I think if the market spends much time below its' year to date break even point (yellow horizontal line) a similar drop taking the S&P to 1815 and 1770 is quite possible.

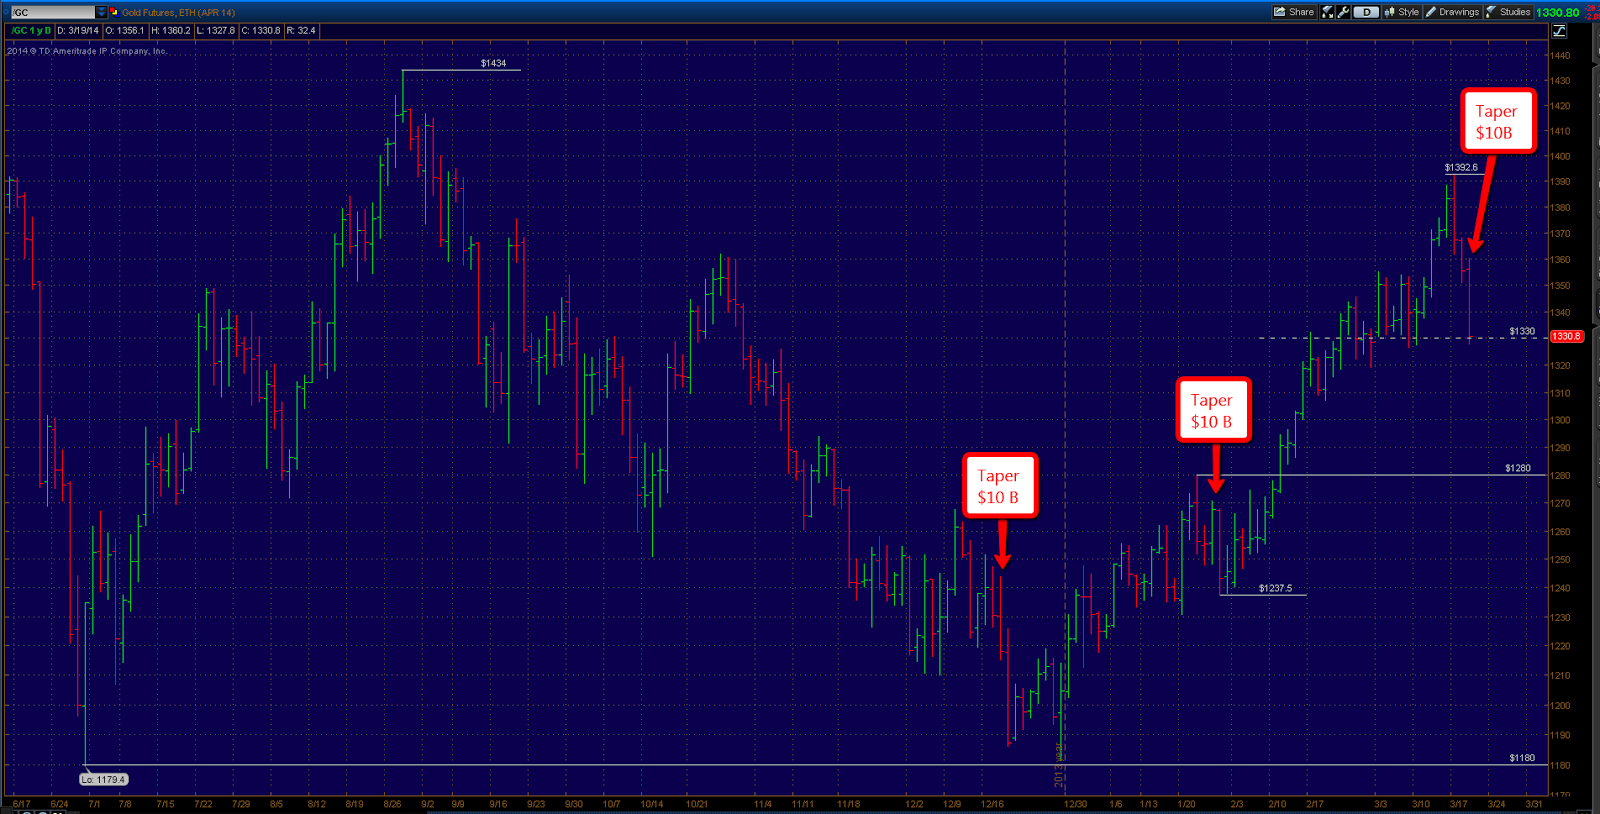
Gold, still outperforming by a clear margin, has seen some recent short term selling pressure as it nears a key pivot high at $1434. Today's drop marks the biggest correct seen in Gold year to date. Near term support comes in roughly at $1330 but expect some short term volatility around this level as there remains a lot of "congestion" left behind in a cluster of swing highs and lows.
One pattern I see in Gold is the day after each taper announcement has taken place, Gold has ended in the red. This is quite a small sample size to get any real edge one way or the other. The next potential downside pivot I see is the low at $1308. This would be almost exactly two times the size of the last short term correction (a common occurrence) and the midpoint of the entire run up from it's low at $1180.

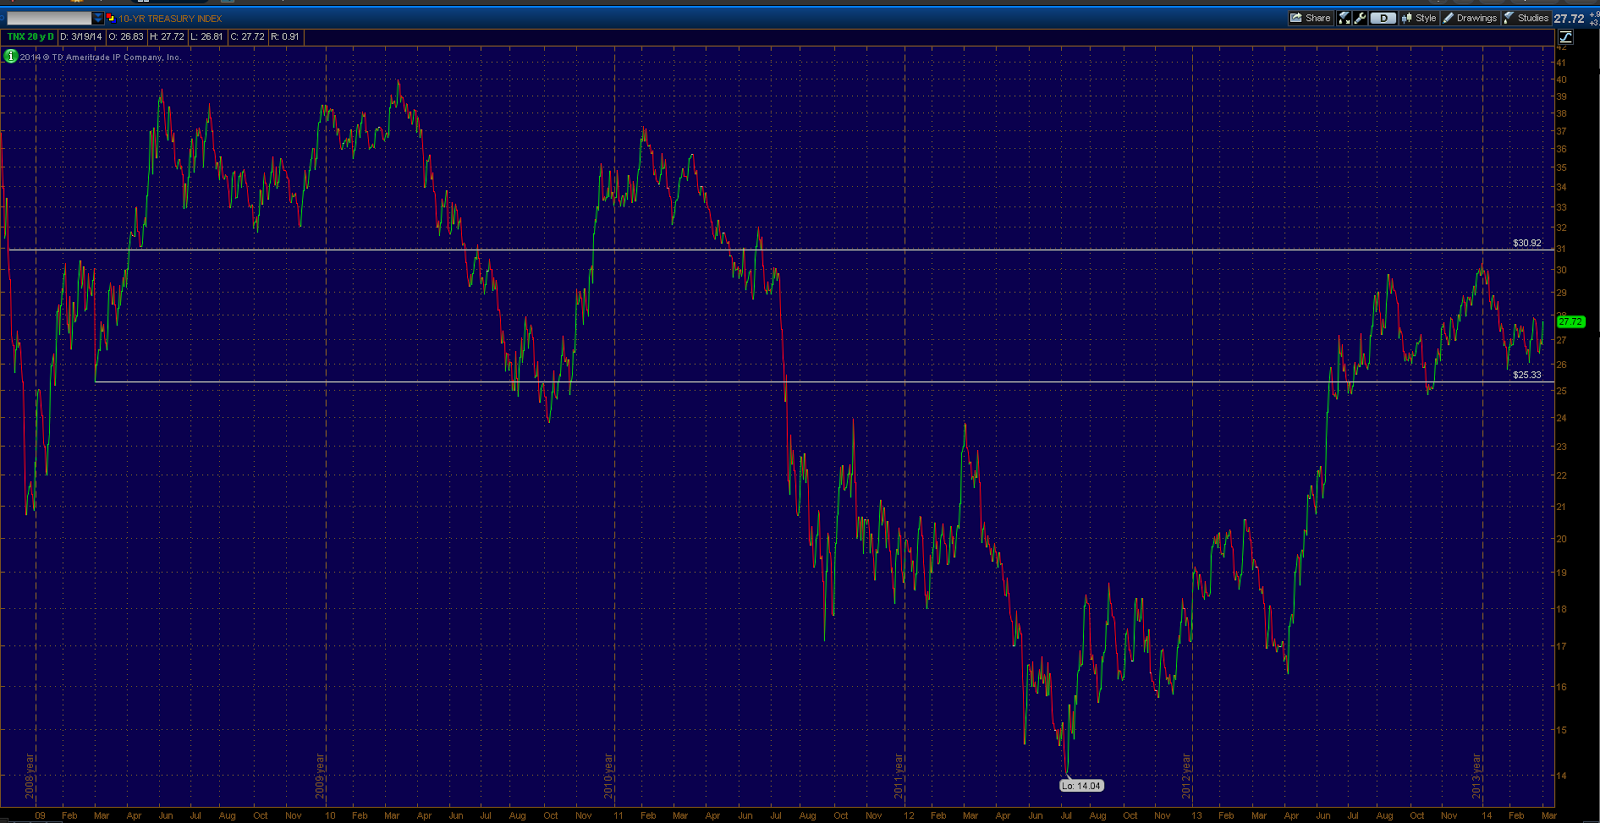
Interest rates spiked today as bond prices fell. The yield or interest rate on the 10 year treasury bonds rose over 3% today. An interesting observation is denoted in the chart above, the horizontal lines show the settlement price on the days QE 1 was announced. This most recent trading range has engulfed those two prior pivots and it appears interest rates are higher now, then when they were when QE 1 was expanded by over $1 trillion of MBS and treasury debt/securities.

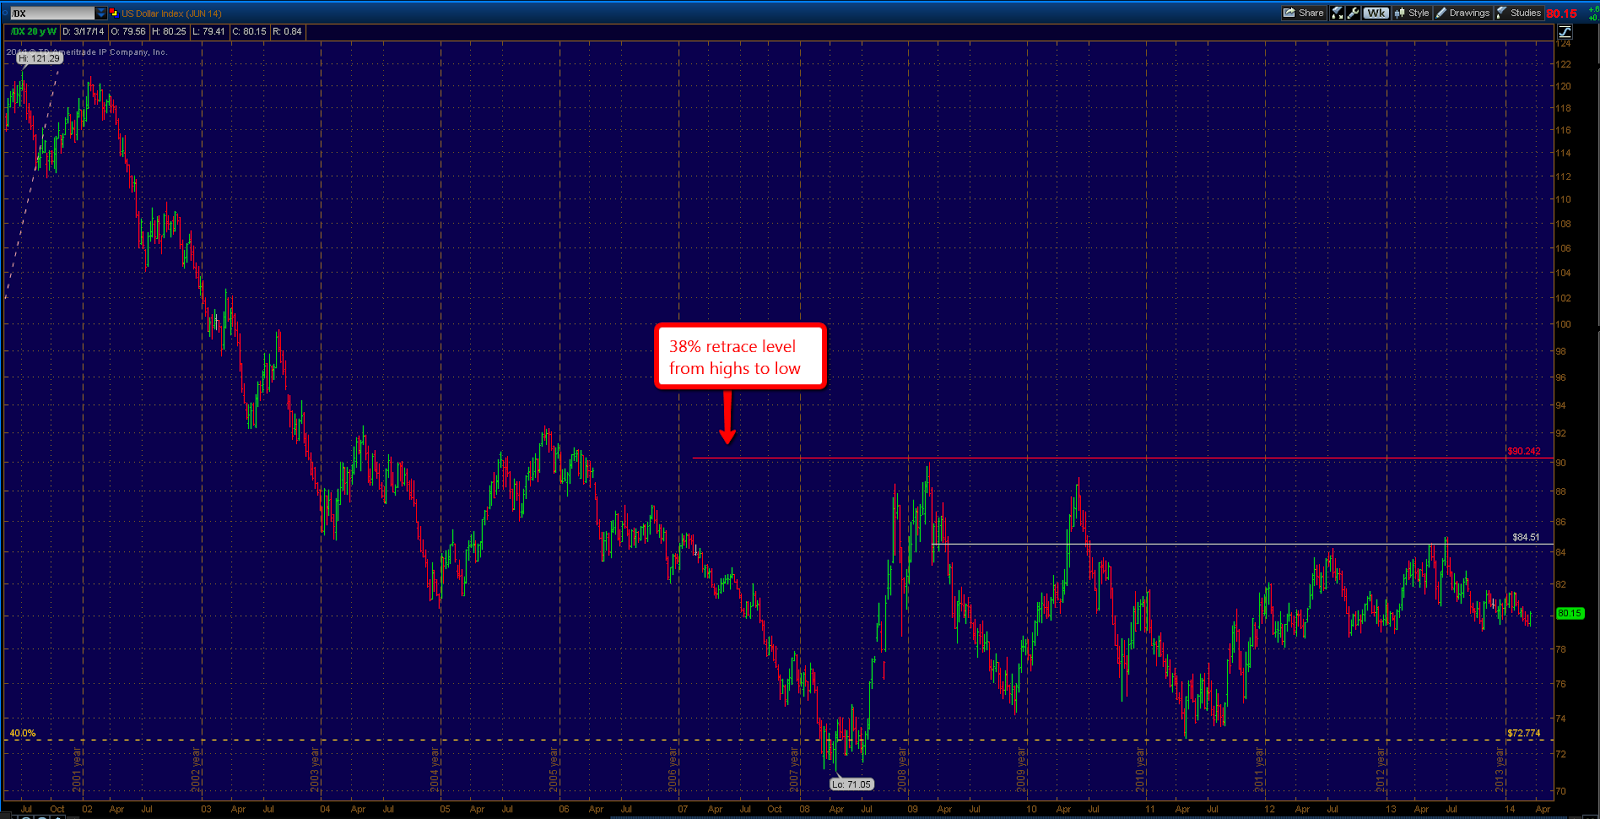
Lastly, taking a look the US dollar via the spot futures continuous contract. I've denoted the $84.50 level (grey horizontal line) which is the settlement price of March 18th, 2009 (QE 1). During the entire time where the Federal Reserve was significantly adding to it's balance sheet, the value of the USD fluctuated from positive 5.2% to negative 13.79%, according to the futures price chart. And the actual swing low came in 2008 before quantitative easing had begun.
Now it's quite obvious on the chart above that the USD had experienced significant devaluation leading into the financial crisis and Fed response. It's quite possible that the market began to price in what was to come, will in advance. Regardless the drop in the USD was 40% from the 2001 high to the 2008 low. And all without more than a brief 38% retrace rally during the financial crisis of 2008 where investors fled from risk assets and demanded USD and treasury bonds.
It's clear from a technical point of view that the USD is still well within a long term downtrend. For me it would take a break above the $90 level to begin to think otherwise. Until then a revisit of 2008 lows is quite possible.
Disclaimer : This website was created for entertainment and educational purposes only. Any opinions and analysis expressed anywhere on this site are for educational and entertainment purposes only, and ARE NOT guaranteed in any way. In no event shall Mikes Trading Journal and everyone involved, have any liability for any losses incurred in connection with any decision made, whether action or inaction, upon the information provided on this web site.
