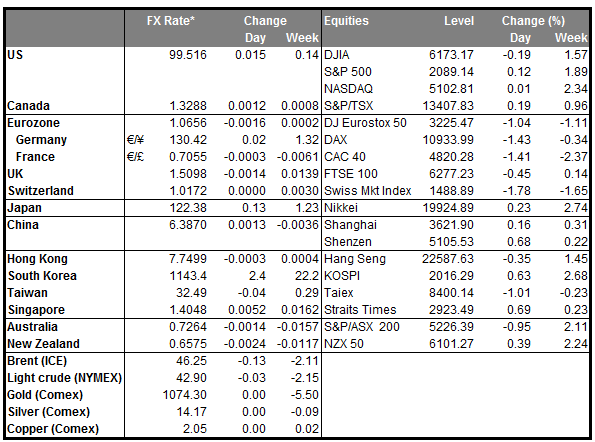
PBoC boosts liquidity to calm the markets China’s central bank injected 130bln yuan (around USD20bln) into the country’s financial system in an effort to calm investors after Monday’s sell-off. By pumping the funds into the market, the Bank aims to signal that it is still on an easing bias and that it stands ready to intervene to support the markets when needed. The Shanghai Composite Index dropped 7% on Monday, triggering an automatic halt to trading that sent a wave of fear in the global markets. The catalyst of yesterday’s carnage in Shanghai stocks wasn’t just the weak PMI data or the yuan fix but rather the fears of over a wave of unlocked shares hitting the market. China’s 6-month banning of shareholders with stakes more than 5% selling their shares nears expiry and this most likely contributed to some downward pressure on stocks.
• In early trading Tuesday in Europe, the Shanghai benchmark index gave back its early gains and fell around 2.4% as we write. In this environment, we could see increased demand for funding currencies including the JPY, CHF, EUR and gold. In addition, escalating geopolitical tensions between Saudi Arabia and Iran offer sufficient reasons to maintain some exposure on the funding currencies. Saudi Arabia's regional allies Bahrain, Sudan and United Arab Emirates (UAE) have stepped up diplomatic pressure on Iran, breaking or downgrading relations with the country. As a result, the turmoil in the Middle East offers no clear reason to hold back from funding currencies.
• Today’s highlights: During the European day, Eurozone’s preliminary CPI for December is forecast to have accelerated to +0.3% yoy, from +0.2% yoy in November. However, German inflation for the same month unexpectedly slowed, which raised concerns that the Eurozone CPI may slow down as well. Given that at its last meeting, the ECB eased policy further to encourage higher inflation, a negative surprise in Eurozone’s inflation rate could leave the door open for additional stimulus in the foreseeable future. This could add further selling pressure on the common currency, at least temporarily. • From Germany, the unemployment rate for December is expected to have remained unchanged at its record low of 6.3%. Following the above-expectations manufacturing PMI for the same month, which showed a continued growth in new orders and consumers’ demand in goods, we could see the labour market to continue to improve. This could drive the unemployment rate even further down in the coming months.
• Norway’s December manufacturing PMI is forecast to have decreased from the previous month but more importantly to remain below the crucial 50-line. If the forecast is met, this would be the 10th consecutive month of contraction. Even though this could weaken NOK somewhat, given the recent rise in oil prices following the turmoil in the Middle East any losses could be short-lived as long as oil prices continue moving higher.
• In the UK, the construction PMI for December is due to be released. The index is forecast to have increased to 56.0 from 55.3 in November. Despite expectations of a rise, the unexpected decline in the manufacturing PMI on Monday increases the possibilities for another weak reading in the construction data. Since the shrink in the manufacturing and construction sectors was the main driver behind the slowdown in the UK GDP for Q3, a possible disappointment in the construction index could add to concerns of a further downturn in growth during Q4. This could put GBP under renewed selling interest.
The Market
EUR/USD hits resistance near 1.0940 and tumbles
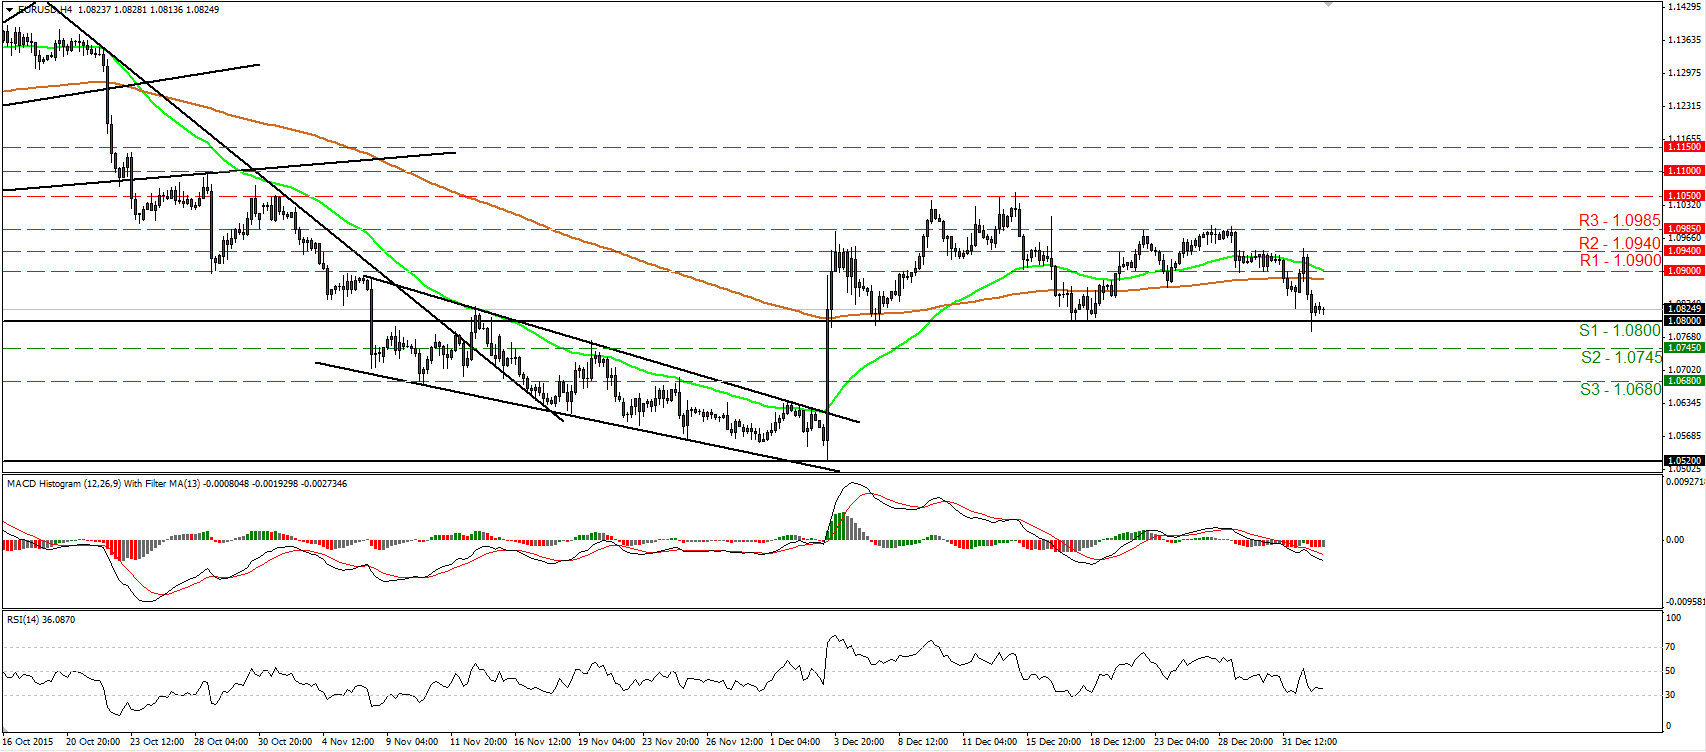
• EUR/USD tumbled on Monday after it hit resistance near the 1.0940 (R2) resistance line. However, the decline was stopped once again near the 1.0800 (S1) support hurdle. In my opinion, the short-term outlook remains somewhat negative, but a clear move below 1.0800 (S1) is needed to carry more bearish extensions. Something like that could initially aim for our next support level of 1.0745 (S2). Our momentum studies detect downside momentum and support the notion. The RSI fell back below its 50 line, while the MACD stands below both its zero and signal lines, pointing south. Switching to the daily chart, I see that on the 7th and 17th of December, the rate rebounded from the 1.0800 (S1) key hurdle, which is also the lower bound of the range it had been trading from the last days of April until the 6th of November. Yesterday we had the third test near that zone. This corroborates my view that a break below 1.0800 (S1) is needed to encourage the bears to drive the rate lower.
• Support: 1.0800 (S1), 1.0745 (S2), 1.0680 (S3)
• Resistance: 1.0900 (R1), 1.0940 (R2), 1.0985 (R3)
NZD/USD breaks below an uptrend line
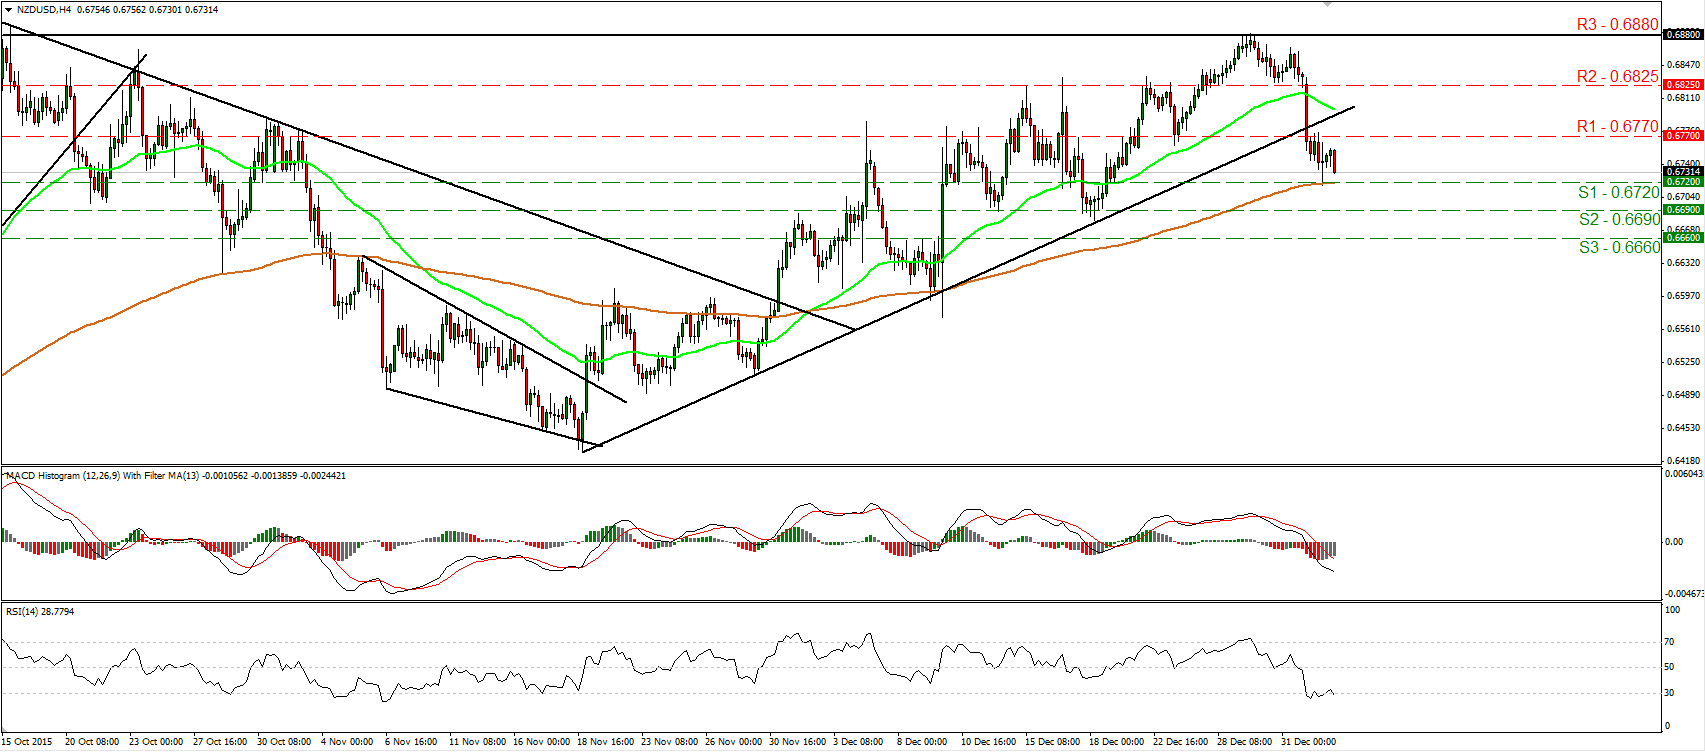
• NZD/USD plunged on Monday, falling below the uptrend line taken from the low of the 18th of November. In my opinion, that break has turned the short-term bias to the downside. Today, during the early European morning, the rate is headed towards the 0.6720 (S1) support line, where a break is likely to initially aim for the next support at 0.6690 (S2). Our short-term momentum indicators detect strong downside speed and magnify the case that further declines could be on the cards. The RSI turned down and fell back below its 30 line, while the MACD lies below both its zero and trigger lines, pointing down. On the daily chart, I see that on the 18th of November, the rate formed a higher low. However, given that the rate was rejected once again by the 0.6880 (R3) zone, I prefer to maintain my flat stance as far as the longer-term picture is concerned.
• Support: 0.6720 (S1), 0.6690 (S2), 0.6660 (S3)
• Resistance: 0.6770 (R1), 0.6825 (R2), 0.6880 (R3)
GBP/JPY rebounds from 175.00
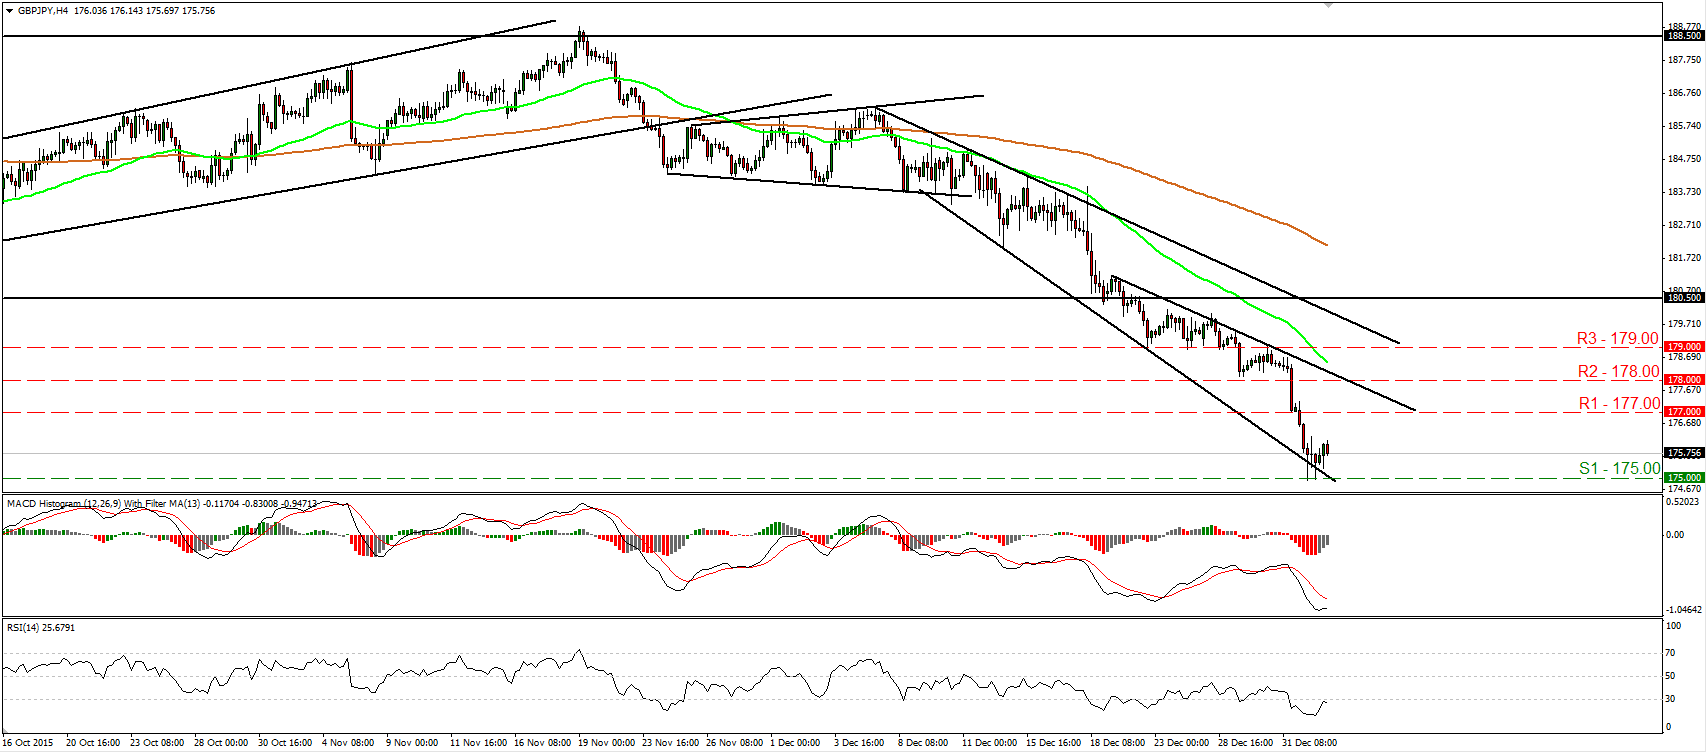
• GBP/JPY moved higher yesterday after it hit support at the psychological barrier of 175.00 (S1). On the 4-hour chart, the price structure still suggests a short-term downtrend, but I would like to see a decisive dip below 175.00 (S1) before getting confident again on its continuation. For now, I see the possibility for the current rebound to continue for a while, perhaps to challenge the 177.00 (R1) area as a resistance this time. This is also supported by our short-term oscillators. The RSI has bottomed within its below-30 zone and could move above 30 soon, while the MACD, although negative, has bottomed as well and looks able to cross above its trigger line in the near future. Zooming out to the daily chart, I see that on the 21st of December the rate fell below the 180.50 key hurdle, which is the lower bound of the wide range the pair had been trading since the 25th of August. Therefore, I would see a negative medium-term picture and I would treat any further short-term advances that stay limited below 180.50 (R2) as a corrective phase.
• Support: 175.00 (S1), 174.00 (S2), 173.00 (S3)
• Resistance: 177.00 (R1), 178.00 (R2), 179.00 (R3)
Gold continues higher
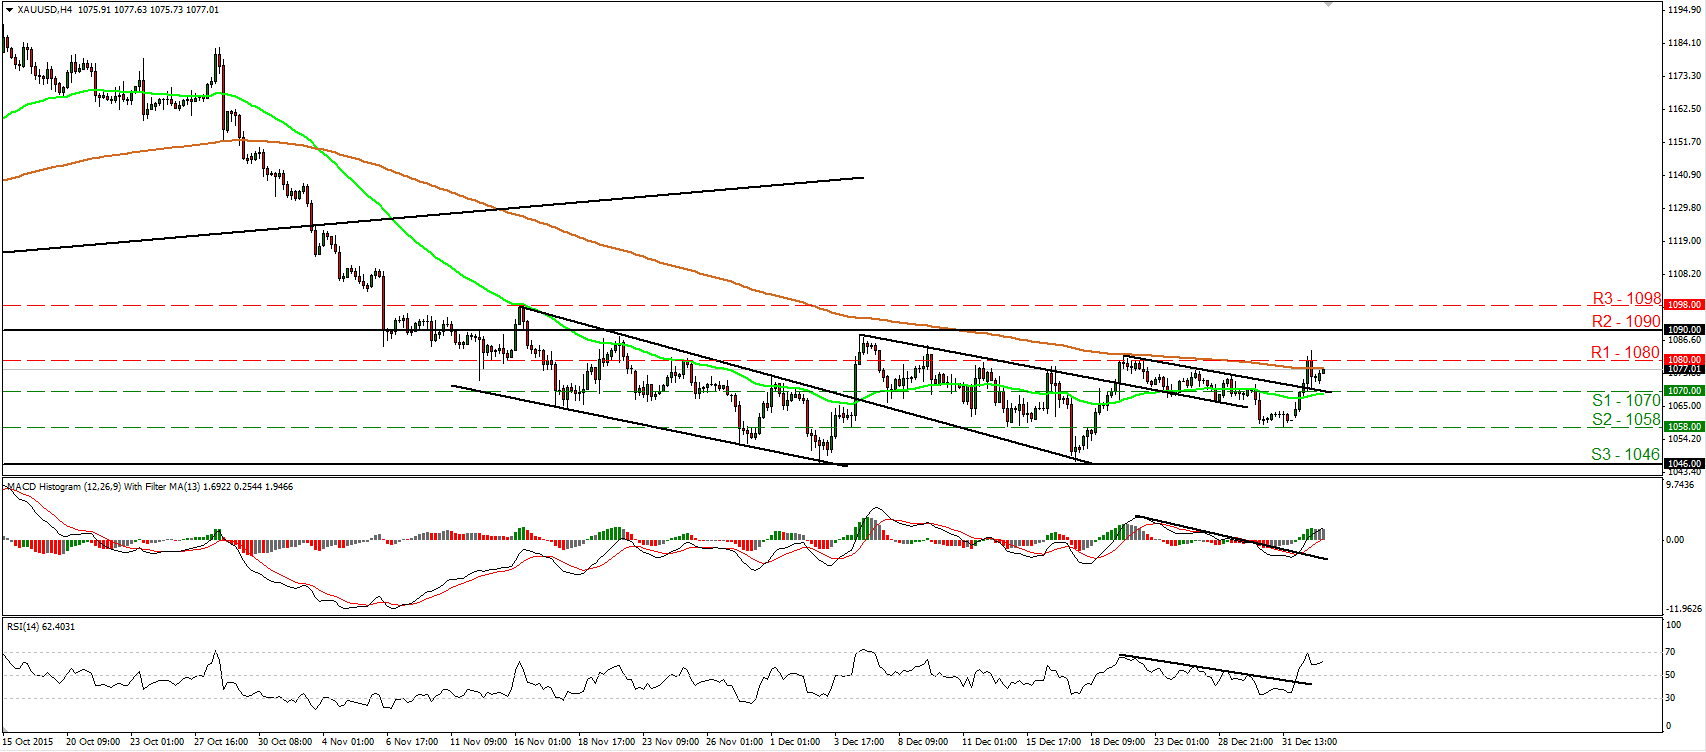
• Gold continued trading higher and managed to emerge above the 1070 (S1) area. The advance was stopped slightly above the 1080 (R1) line and then, the metal retreated to challenge the 1070 (S1) barrier as a support and the prior downside resistance line taken from the peak of the 21st of December. As long as the price is trading above that trend line, I see the likelihood for the positive move to continue above 1080 (R1). Such a move is likely to prompt extensions towards the key resistance zone of 1090 (R2). Our short-term oscillators corroborate that view as well. The RSI, already above 50, turned up again, while the MACD stands above both its zero and trigger lines. What is more, both these indicators managed to overcome their downside resistance lines. As for the broader trend, as long as the metal is trading between 1046 (S3) and 1090 (R2), I prefer to stay flat as far as the longer-term picture is concerned. A clear close above 1090 (R2) is needed to bring a possible medium-term trend reversal in my view.
• Support: 1070 (S1), 1058 (S2), 1046 (S3)
• Resistance: 1080 (R1), 1090 (R2), 1098 (R3)
DAX futures rebound from above 10200
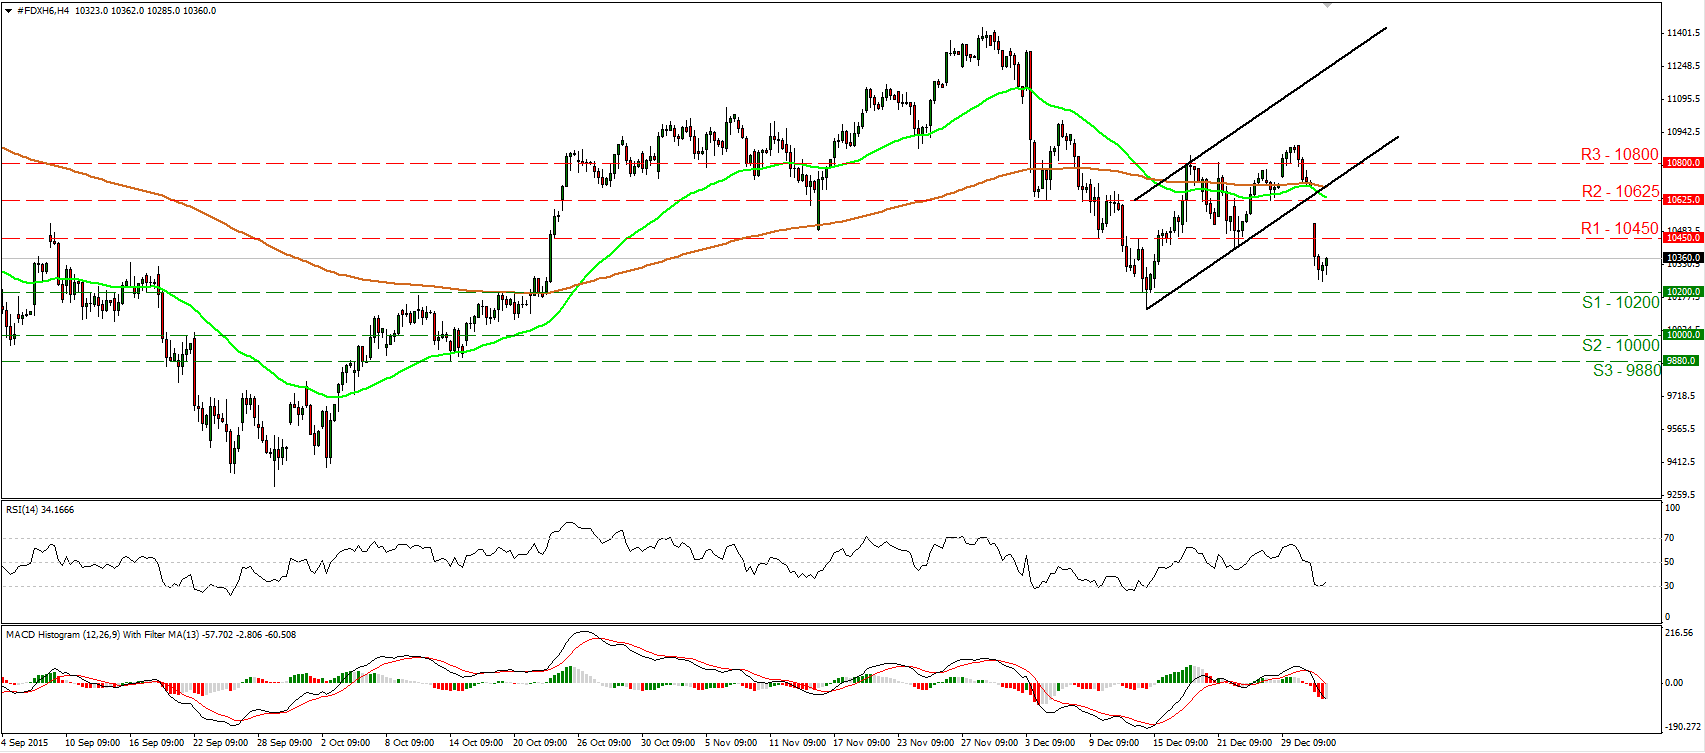
• DAX futures collapsed yesterday, falling below the 10450 (R1) support (now turned into resistance) zone. However, the tumble fell short of reaching the 10200 (S1) area and hit support slightly above that zone. The short-term outlook remains negative in my view, but taking a look at our short-term oscillators, I see the likelihood of an upside corrective move before and if the bears decide to shoot again. The RSI rebounded from its 30 line, while the MACD, although negative, shows signs that it could start bottoming. As for the broader trend, the price structure on the daily chart points to a downtrend as well. However, I prefer to see a close below 10200 (S1) to trust larger negative extensions. Such a break could initially aim for the psychological zone of 10000 (S2).
• Support: 10200 (S1), 10000 (S2), 9880 (S3)
• Resistance: 10450 (R1), 10625 (R2), 10800 (R3)

