Being a Market Technician has a lot of freedom. Because my trades are based off of price action I can look at any company in any sector any day for a possible trade. No boundaries. I know that is hard for many to understand. They think we are detached floating through space or something.
I hear things like (these are the clean ones) “How can you buy that stock, it has a forward P/E of 60 and the industry average is only 33, plus its margins are sinking?” or ‘The economic environment shows a slowing in consumer spending so it is time to pump the brakes on stocks.” I have been around the sun a few times and also hold a CFA designation so I know what these people are talking about. And their thoughts and comment may play out eventually over time. But day to day they just do not matter.
One of the quirky things about being a Technician is that sometimes I have no idea what a company does when I am looking at a chart. Here is a good example, PerkinElmer (NYSE:PKI). This stock could be the holding company for Perkin’s Pancake House, Elmer’s Glue, or anything else. So I often look them up to find out what they do. Here is what Yahoo Finance YHOO says about PerkinElmer:
Well that clears things up. So no pancakes or glue, but huh? Whatever. It is the price action that catches my attention anyway.

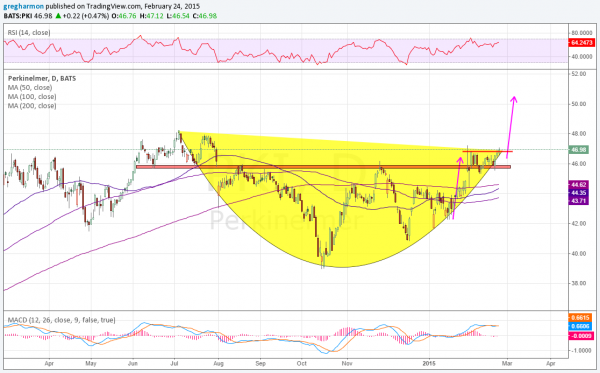
The chart above shows the price action over the last year. 3 things are prominent in this chart. First, the pullback from the July high in a rounded bottoming format. It is clearly heading higher now since the October low. Second, is the red zone just under 46 that was important for buyers in June and July and sellers in August and November is now important for buyers again, acting as a support level.
The third is the short term red line that has acted important for sellers, a resistance level, until Tuesday. With the move over that level the selling has abated and it is time to own the stock for a move higher. It may encounter another area of selling at the prior high near 48, but history shows there is not much inventory of holders at that level to work through to continue higher.
How high could it go? Who knows. But one measure is to look at the move into the range between support and resistance and add that back to the break out. This suggests that a move to 50.50 is possible. Technicians will point out other patterns that could move the stock higher as well. But a quick 7.5% would not be anything to snarl at. Unless you don’t like the earnings multiple, or sales to book ratio or something else.
Disclaimer: The information in this blog post represents my own opinions and does not contain a recommendation for any particular security or investment. I or my affiliates may hold positions or other interests in securities mentioned in the Blog, please see my Disclaimer page for my full disclaimer.

