We are approaching the end of February and within a month, the end of the first quarter. So we continue from where we left of about a month ago. At that time, we focused on the US stock market breadth readings, which were showing extreme oversold readings from the short term perspective.
We experienced the largest spike in 52-week new lows since the August 2011 crash, AD line and UD volume (averaged over two weeks) at most oversold reading since August 2011 and once again we saw a percentage of stocks above their respective 50 day moving average within the S&P Index move into single digit readings.
Within a day of my piece, the US broad index bottomed (good timing), posting a slight rebound into late January, followed by a retest of the lows into last week.
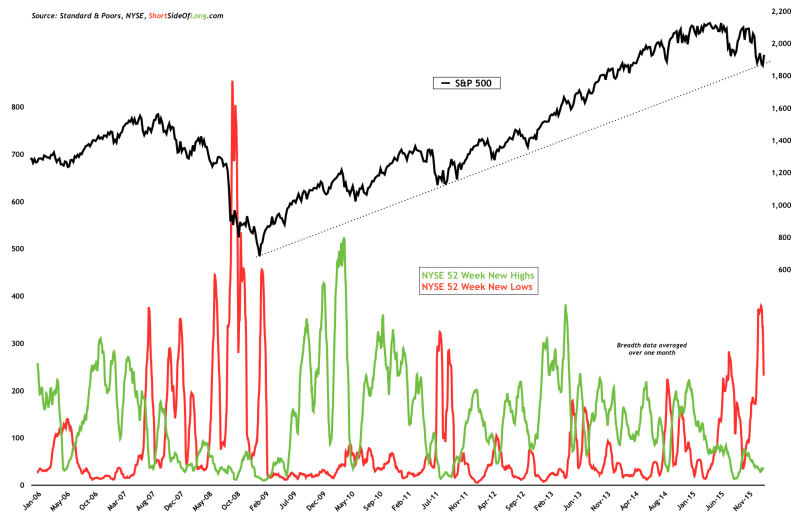
Interesting point to make about the start of 2016 is that when averaged over 21 business days—or one trading month—selling pressure, measured by the number of stocks registering 52 week new lows on the NYSE, has been the strongest since the Global Financial Crisis of 2008/09. In other words, US indices, mainly supported by the technology darling FANG stocks, are masking the actual weakness that almost all individual stocks have experience for a year now.
And it is important to state that even during strong downtrends and powerful bear markets, such selling pressure cannot last indefinitely without a relief rally to work off oversold conditions. It is precisely what we have been witnessing over the last three trading days.
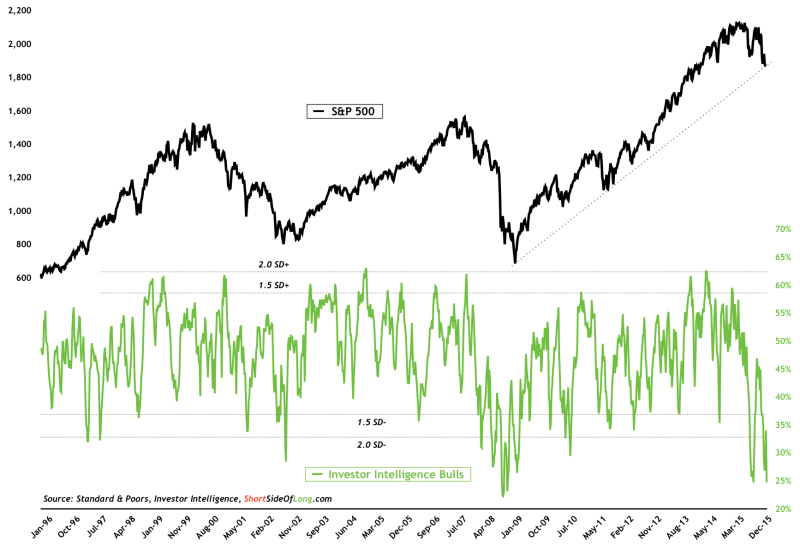
Moreover, sentiment became very negative throughout the early part of February. In some instances, various indicators have fallen to levels of pessimism rarely seen over the last three decades while others match the fear seen during the depths of the Global Financial Crisis in 2008.
Surveys, such as AAII or Investor Intelligence seen in the chart above, are at rock bottom levels. Retail investors (dumb money) have been heavy buyers of put options, while market participants around the world have recently flocked into safe havens such as Treasury bonds, Japanese yen and gold. All three of these asset classes have moved up in vertical fashion over the short term, a clear indicator of fear. Finally, various credit spreads and credit default swap indices have also spiked sharply (usually seen near intermediate or major market lows).
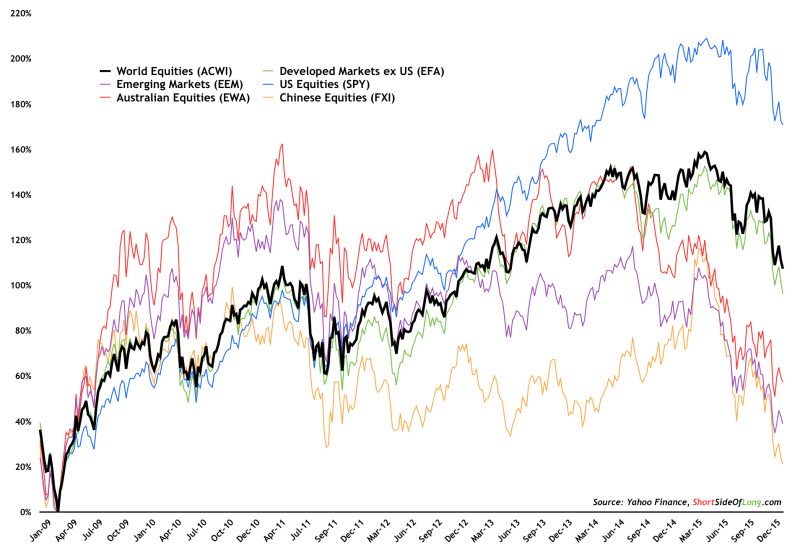
If one was to only observe the US indices, it would be easy to come to the conclusion that the market has barley corrected from the May 2015 record highs. However, other global markets (priced in US dollars) have had meaningful… and I repeat… meaningful, adjustments in both price, time and valuations.
Focusing on the chart above, we can see that since the March 2009 lows, Emerging Markets (via iShares MSCI Emerging Markets (N:EEM)) and in particular Asia Pacific equities (via iShares MSCI Australia (N:EWA) and iShares China Large-Cap (N:FXI)), have underperformed. It is worth noting that the China H-Shares traded at price- to-book value of 0.79 only last week and at the same time was only 20% above its March 2009 lows.
As an example, for S&P 500 to trade at such a heavy discount or that close to its last major trough, its price level would have to be below 1,000 points on the index – pretty much a 50% sell-off from current levels (not necessarily my prediction).
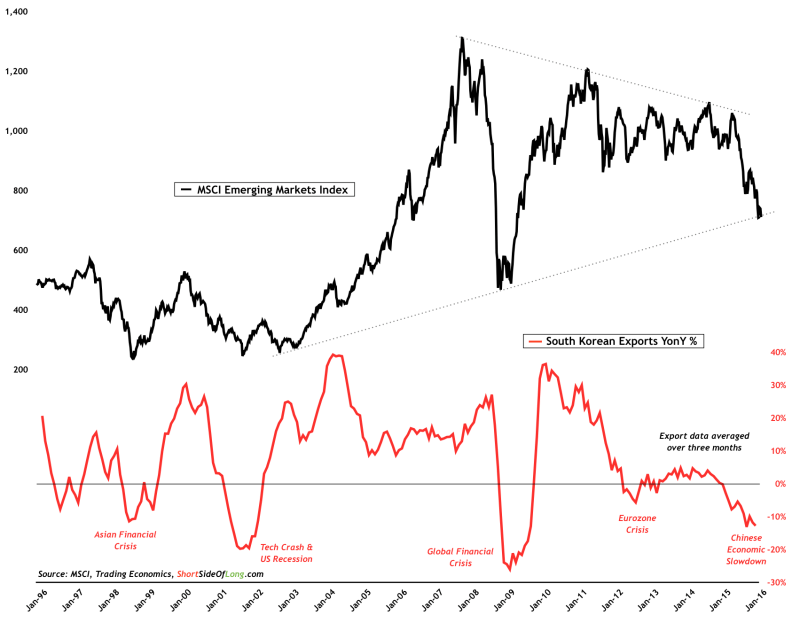
The Chinese economic slowdown continues to affect the majority of the Asian economies, in particular South Korea, HK, Macau and Singapore. As I have mentioned many times, it is difficult to trust any government publications, especially the Chinese government data.
This is why I prefer to use South Korean export data to gauge the strength of Asian, as well as global, growth. South Korea is an export powerhouse, which is leveraged towards both new and old economic activity. Major exports include semiconductors, petrochemicals, machinery, automobiles, ships, steel, LCD and wireless communication devices. with trading partners such as China, the ASEAN region, the United States and the European Union. Therefore, if we assume that South Korean export data is a decent barometer of the overall global economy, the latest drop of 18.7% from a year ago should be quite worrying.
Furthermore, when averaged over three months, exports continue to be at their most depressed levels since the 2008 recession.
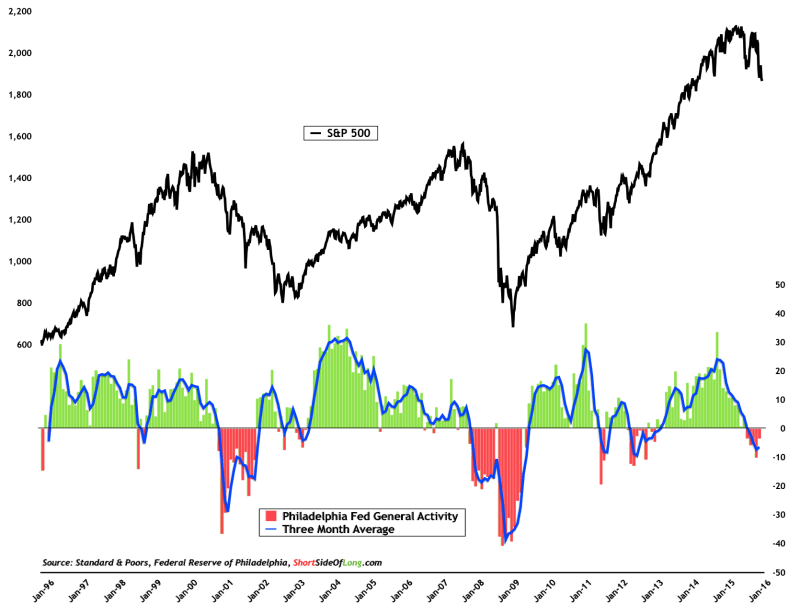
United States economic activity has also slowed considerably, according to the Philadelphia Fed General Activity Index, which I prefer to use when monitoring the economic activity of the worlds biggest economy. The indicator clearly showed depressed sentiment and recessionary economic activity during 2001 and 2008.
It also showed that the US economy experienced a considerable slowdown during the prolonged Eurozone Crisis episode from early 2011 into late 2012. At present, the current conditions closely resemble the slowdown that occurred during the 1998 Asian Financial Crisis and my best guess is that the US economy is NOT in a recession just yet. However, I would like to add that without any notable recovery in the near term, we could very well be on the cusp of one.
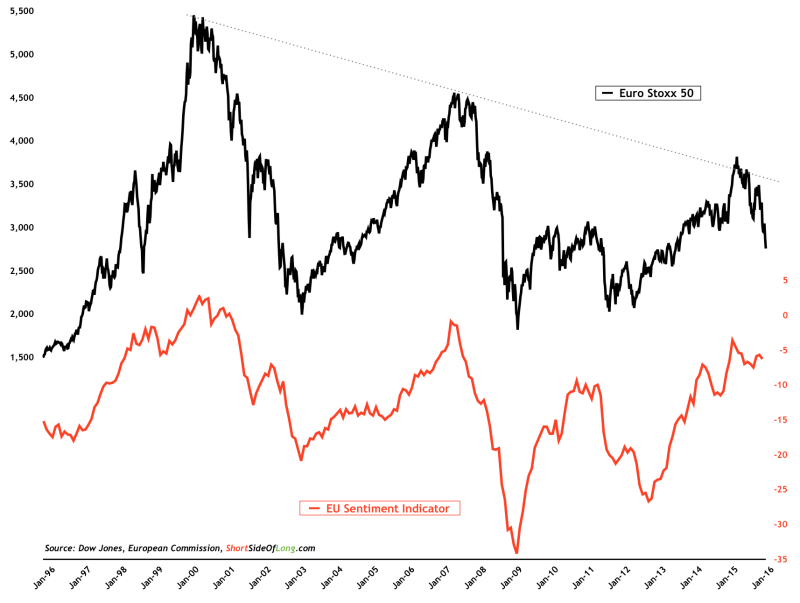
Consumer sentiment has been rather high in Developed Markets (US, EU and Japan) over the last few quarters. From a contrarian perspective, confident consumers usually signal that retail spending is at its peak and therefore future stock market performance will most likely disappoint as earnings come below perma-bullish Wall Street analysts expectations. Therefore, recent global stock market sell-offs—from the US to Japan and the Eurozone (Euro Stoxx 50 chart above) should not be a surprise to any of us.
I will be closely monitoring the recent stock rebound and how it behaves in days and weeks ahead. When coming out of extreme pessimism and oversold conditions, such as we saw in January of 2016, further buying interest in the short term usually (but not always) indicates positive performance in the medium term as well.
On the other hand, the sharp and swift failure of a relief rally would indicate that the downtrend is still in progress and that economic activity might deteriorate somewhat more.
