
Just about every economists and major market player has come out of the closet as a bear on the bond market. Recently we’ve seen massive outflows from bond funds and even on days like yesterday as equities weaken, bonds were unable to catch a bid. But I think things may be approaching a reflection point in the bond market.
Yesterday we looked at the relationship between 10-year and 30-year Treasury yields. Today I want to focus on the 10-year and what it may be whispering about the bond market.
Below is the weekly chart of the 10-year Treasury yield going back to 1981. You can see that yields have been falling for over 30 years as bonds have been in a bull market.
Two Yield Barriers
However, when yields have risen, there appear to be two things that have gotten in their way. First we have the 200-week moving average (blue line). Recent examples are 2010 and 2011, when we approached or hit the 200-week MA -- putting a bid under bond prices as the 10-year yield corrected. Going back to the start of the bond bull market, there are just three instances (’94, ’00 and ’06) where yield was able to stay above its long-term moving average for a meaningful period of time.
Now turning to momentum. Using the Relative Strength Index we can see that we have only gotten “overbought” on yield (i.e. bond prices were ‘oversold) 16 times in the last 30 years! Typically we have experienced RSI diverging before yields fell (and bond prices rose) as the indicator broke above 70 and as yield continued to rise, RSI being unable to maintain its overbought status. Although, 2011 was the exception to the rule, so to speak, with yields dropping just after RSI became overbought.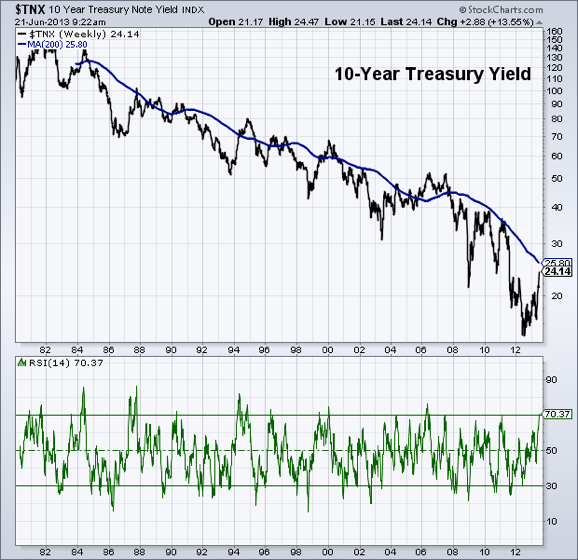
It's Entirely Possible
So are we about to experience a resurgence in bonds? Based on the above chart, it’s possible we see yields rise further, possibly testing the 200-week moving average and allowing momentum to weaken. But we could bond buyers step in here with yields rising in almost a straight line since May. I’ll be watching to see if momentum can stay elevated on a weekly basis or if things begin to weaken.
Disclaimer: Do not construe anything written in this post or this blog in its entirety as a recommendation, research, or an offer to buy or sell any securities. Everything in this post is meant for educational and entertainment purposes only. I or my affiliates may hold positions in securities mentioned in the blog. Please see my Disclosure page for full disclaimer. Connect with Andrew on Google+, Twitter and StockTwits.
- English (UK)
- English (India)
- English (Canada)
- English (Australia)
- English (South Africa)
- English (Philippines)
- English (Nigeria)
- Deutsch
- Español (España)
- Español (México)
- Français
- Italiano
- Nederlands
- Português (Portugal)
- Polski
- Português (Brasil)
- Русский
- Türkçe
- العربية
- Ελληνικά
- Svenska
- Suomi
- עברית
- 日本語
- 한국어
- 简体中文
- 繁體中文
- Bahasa Indonesia
- Bahasa Melayu
- ไทย
- Tiếng Việt
- हिंदी
Or, Are Bond Prices Close To Bottoming?
Published 06/21/2013, 10:25 AM
Updated 07/09/2023, 06:31 AM
Or, Are Bond Prices Close To Bottoming?
3rd party Ad. Not an offer or recommendation by Investing.com. See disclosure here or
remove ads
.
Latest comments
Install Our App
Risk Disclosure: Trading in financial instruments and/or cryptocurrencies involves high risks including the risk of losing some, or all, of your investment amount, and may not be suitable for all investors. Prices of cryptocurrencies are extremely volatile and may be affected by external factors such as financial, regulatory or political events. Trading on margin increases the financial risks.
Before deciding to trade in financial instrument or cryptocurrencies you should be fully informed of the risks and costs associated with trading the financial markets, carefully consider your investment objectives, level of experience, and risk appetite, and seek professional advice where needed.
Fusion Media would like to remind you that the data contained in this website is not necessarily real-time nor accurate. The data and prices on the website are not necessarily provided by any market or exchange, but may be provided by market makers, and so prices may not be accurate and may differ from the actual price at any given market, meaning prices are indicative and not appropriate for trading purposes. Fusion Media and any provider of the data contained in this website will not accept liability for any loss or damage as a result of your trading, or your reliance on the information contained within this website.
It is prohibited to use, store, reproduce, display, modify, transmit or distribute the data contained in this website without the explicit prior written permission of Fusion Media and/or the data provider. All intellectual property rights are reserved by the providers and/or the exchange providing the data contained in this website.
Fusion Media may be compensated by the advertisers that appear on the website, based on your interaction with the advertisements or advertisers.
© 2007-2024 - Fusion Media Limited. All Rights Reserved.