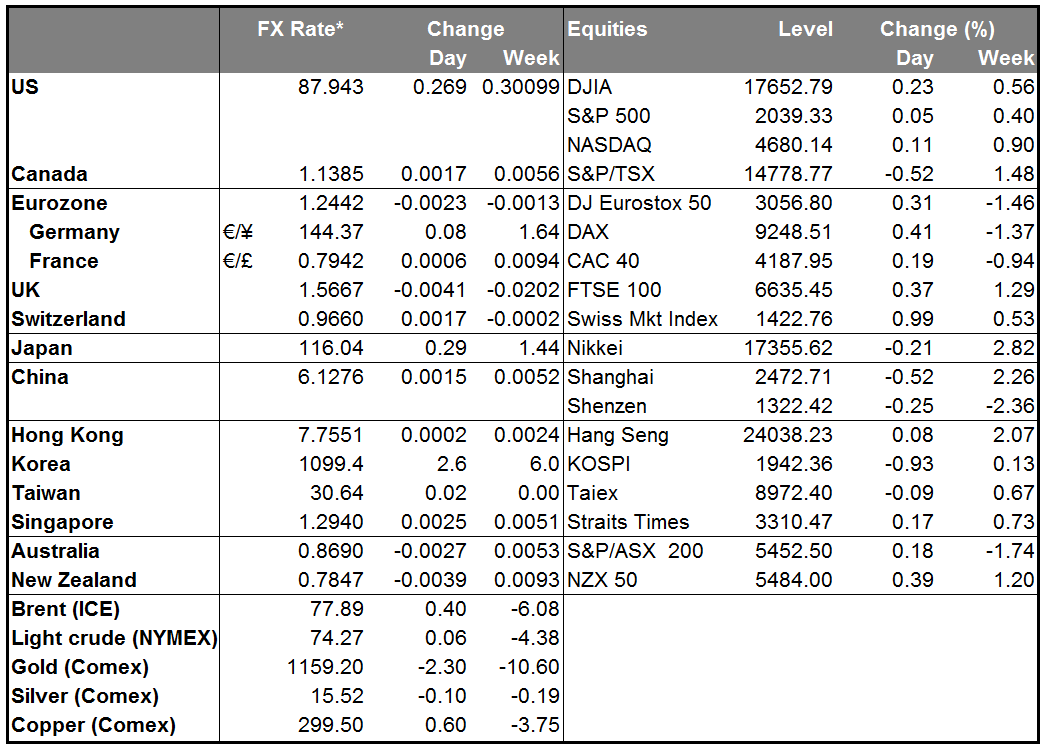
A fairly quiet day in the financial markets but a huge day for oil. With little news to move the market, U.S. 10-Year yields were down 3 bps, stocks closed virtually unchanged for the third day in a row and the dollar was generally higher.
The biggest action was in the oil market, where prices plunged further. Iraq and Kurdistan reached a deal on oil exports that could add as much as 400k b/d to oil supply next year. Iran’s negotiations with the US over the former’s nuclear projects continue, holding open the possibility that Iranian supplies will be available to the West if an agreement is reached. Meanwhile, OPEC is resisting calls to cut production at its Nov. 27th meeting and instead is cutting export prices to the US, where there is already a glut of oil, in an apparent effort to force high-cost US shale producers out of the market. The decline in oil prices is likely to have a beneficial effect on global economies: Wal-Mart Stores Inc. (NYSE:WMT) Stores, for example, announced a rise in same-store sales in Q3 for the first time seven quarters, with declining gasoline prices cited as one of the causes. On the other hand, lower oil prices are causing a headache for central banks as inflation falls around the world. Poland’s CPI was -0.6% yoy in October, the lowest since 1982, while the Bank of Italy warned that a prolonged period of price stagnation would damage its hopes of lowering its huge public debt, now the second highest in Europe after Greece at 132% of GDP.
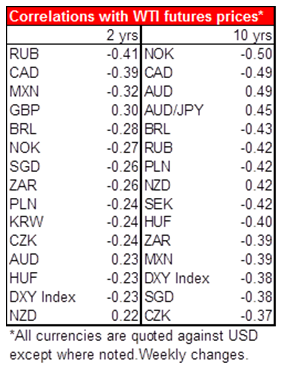
The collapse of oil prices is bad news for the commodity producing countries and indeed CAD was the second-worst performing G10 currency after GBP, which is still suffering the after-effects of Wednesday’s inflation report. Energy exports, largely to the US, account for 24% of Canada’s total exports and so US energy prices are crucial for Canada’s terms of trade. On the other hand, NOK was stable vs USD yesterday. Over the last 10 years, the currency pairs most sensitive to oil prices have been USD/NOK, USD/CAD, AUD/USD, AUD/JPY and USD/BRL. Looking at a shorter time frame (the last two years), USD/RUB tops the list and USD/MXN is fairly high in the list as well.
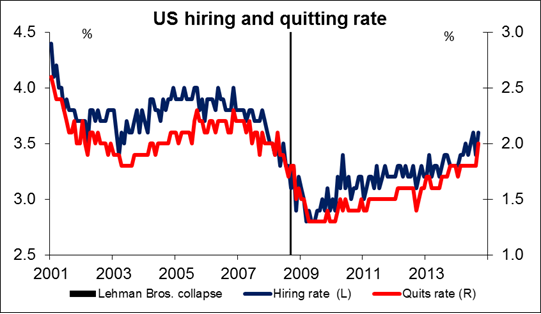
The US Job Opening and Labor Turnover Survey (JOLTS) report showed job openings down more than expected in September at 4.735mn, off from 4.835mn in August. However, the market’s focus here is on the “quit rate,” that is, the rate at which US workers quit their jobs. This is a great indication of confidence in the job market, because in today’s world, few people are going to quit their jobs unless they are confident they can get another one soon. The quit rate rose to 2.0% from 1.8%, so it is now back to around levels comparable to before the financial crisis. This is an encouraging bit of news for the US labor market. Nonetheless, long-dated US Fed funds rate expectations were down 3.5 bps.
Today’s indicators: During the European day, preliminary GDP data for Q3 are coming out from France, Germany and the Eurozone as a whole. Eurozone’s preliminary GDP for Q3 is expected to have expanded a mere 0.1% qoq from a stagnating Q2. The recent disappointing German factory orders and industrial production in September increase the possibility for a below-consensus reading. EUR/USD has been trading in a tight range in the last couple of days ahead of the GDP figures. A weak number could be the catalyst to push the pair below 1.2400 again, in my view.
Separately, Eurozone’s final CPI for October is expected to remain unchanged from its flash estimate of 0.4% yoy.
From the UK, construction output for September is forecast to rise, a turnaround from August.
In Canada, we get manufacturing sales for September.
In the US, retail sales for October is forecast to rise 0.2% mom, a turnaround from -0.3% mom in September. Similarly, retail sales excluding the volatile items of autos and gasoline are expected to have risen, a rebound from the previous month. After last month’s unexpected drop, a rebound could strengthen USD. The preliminary University of Michigan consumer confidence sentiment for November is also coming out.
As for Friday’s speakers, the talkative ECB Executive Board member Benoit Coeure speaks again, as well as St. Louis Fed President James Bullard and Fed Vice Chairman Stanley Fischer.
The Market
EUR/USD still in a symmetrical triangle
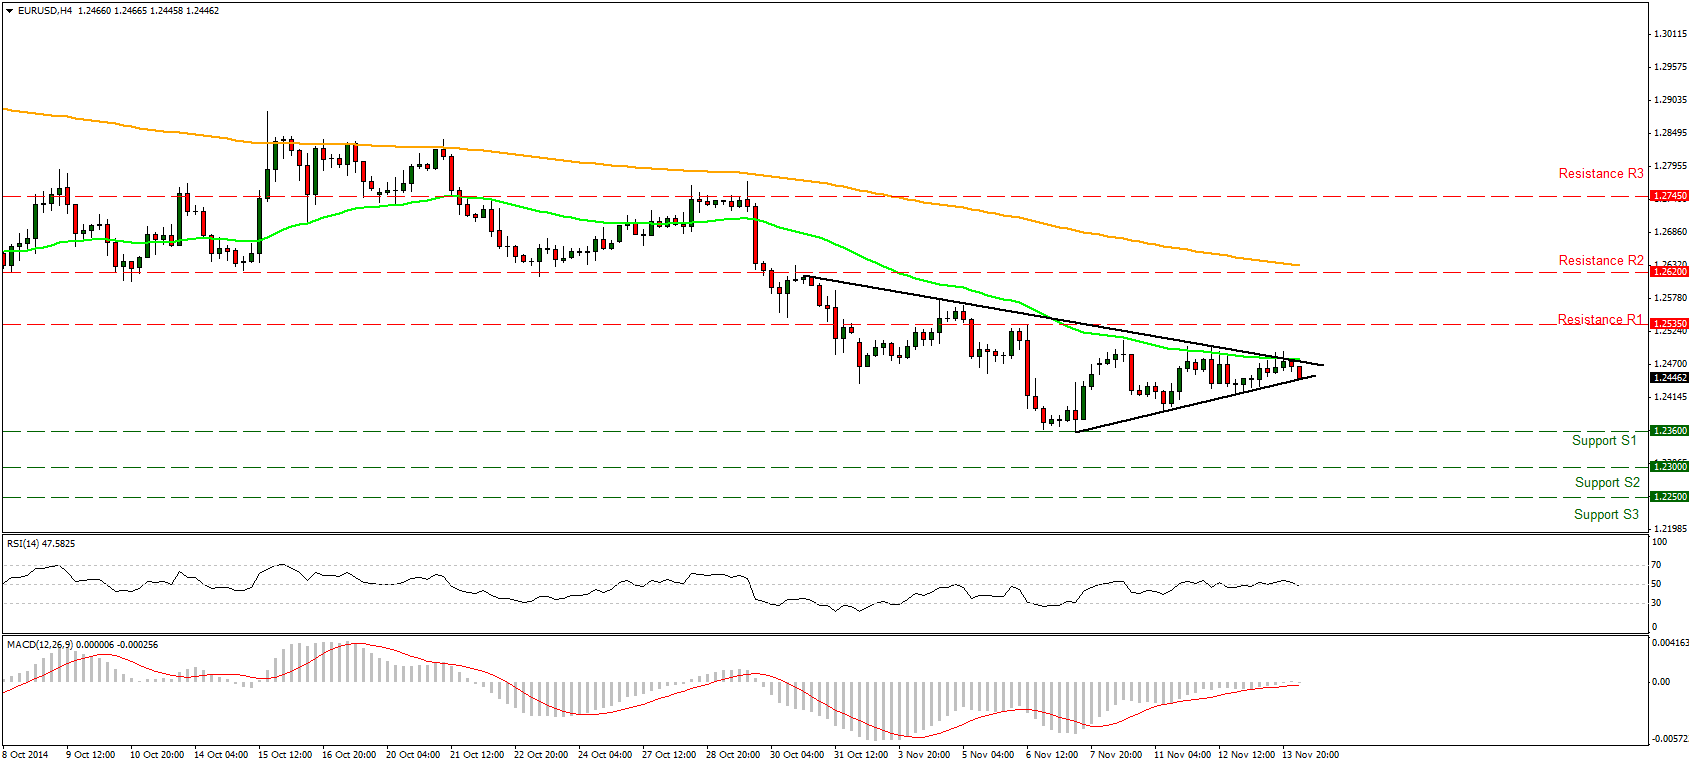
EUR/USD remains capped below the 50-period moving average and within the symmetrical triangle formation. There were a couple of attempts to break the near-term trend line, but none of them found much support. The directionless movement of the pair reflect investors’ concerns ahead of today’s Eurozone’s GDP figures. The recent data suggest that growth in the bloc is slowing, which could trigger the breakout and set the direction of the pair. Usually symmetrical triangles are thought of as a continuation pattern and a break in either direction is likely to determine the near-term bias. Given the sluggish growth outlook for the bloc, this put more chances of a downward breakout, in my view.
• Support: 1.2360 (S1), 1.2300 (S2), 1.2250 (S3).
• Resistance: 1.2535 (R1), 1.2620 (R2), 1.2745 (R3).
GBP/USD tumbled on Thursday
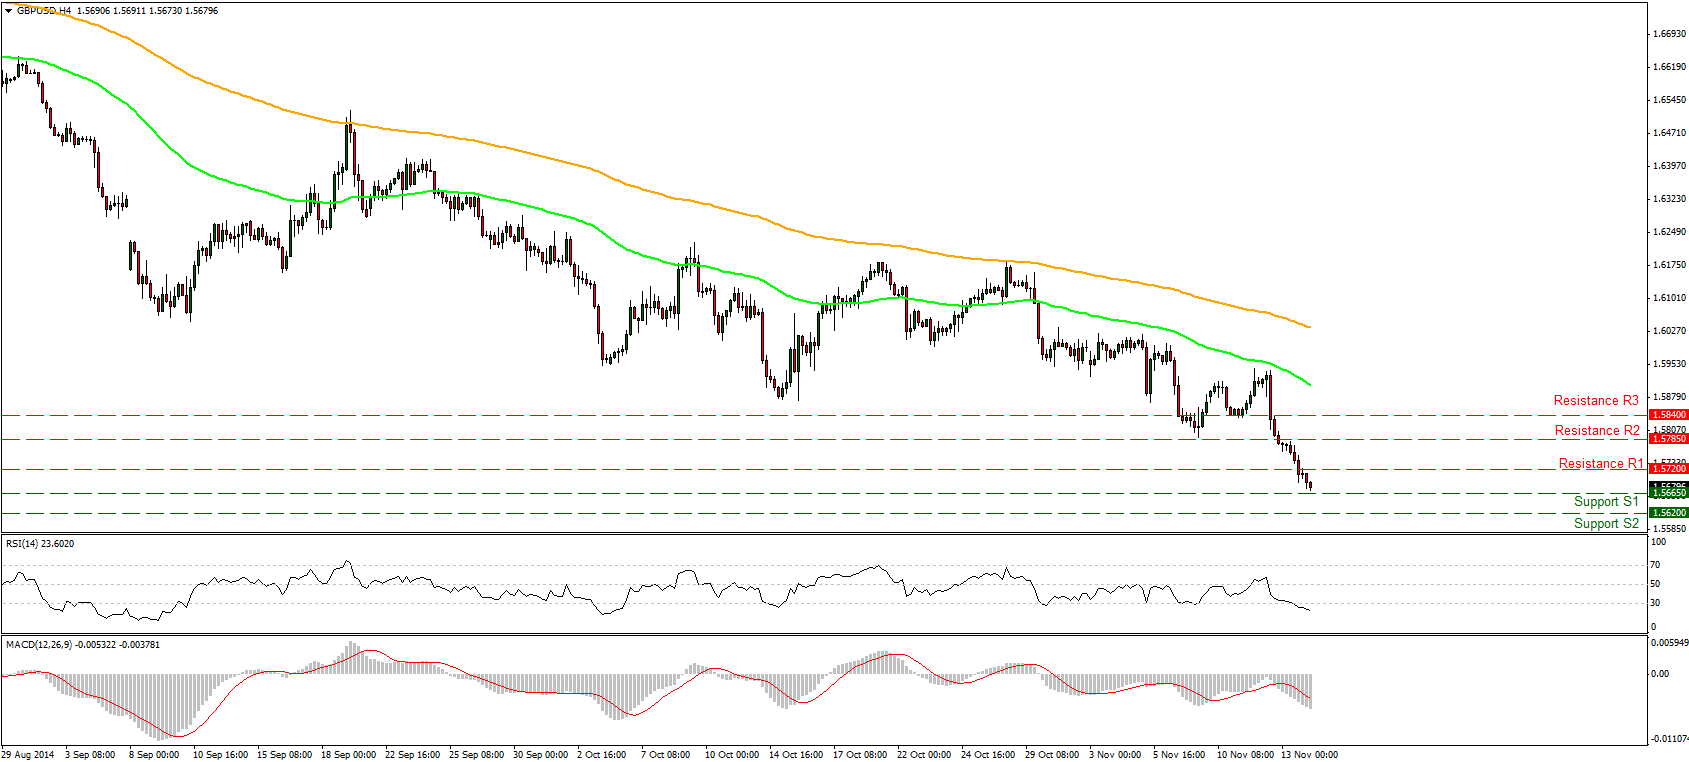
GBP/USD tumbled on Thursday, breaking below our support (turned into resistance) line of 1.5720 (R1). The dip below the 1.5785 (R2) signaled a forthcoming lower low on the daily chart and supported the case for further declines. During the early European hours the pair is heading towards our support of 1.5665 (S1), where a break will likely have larger bearish implication and would target 1.5620 (S2) support line. Our momentum signs support this notion: the RSI moved further into its oversold territory and is pointing down, while the MACD, already in its negative territory, shows no sign of bottoming. These oscillators suggest accelerating bearish momentum. In the bigger picture, I maintain my view that as long as the pair is trading below the 80-day exponential moving average, the overall path remains negative.
• Support: 1.5665 (S1), 1.5620 (S2), 1.5550 (S3) .
• Resistance: 1.5720 (R1), 1.5785 (R2), 1.5840 (R3).
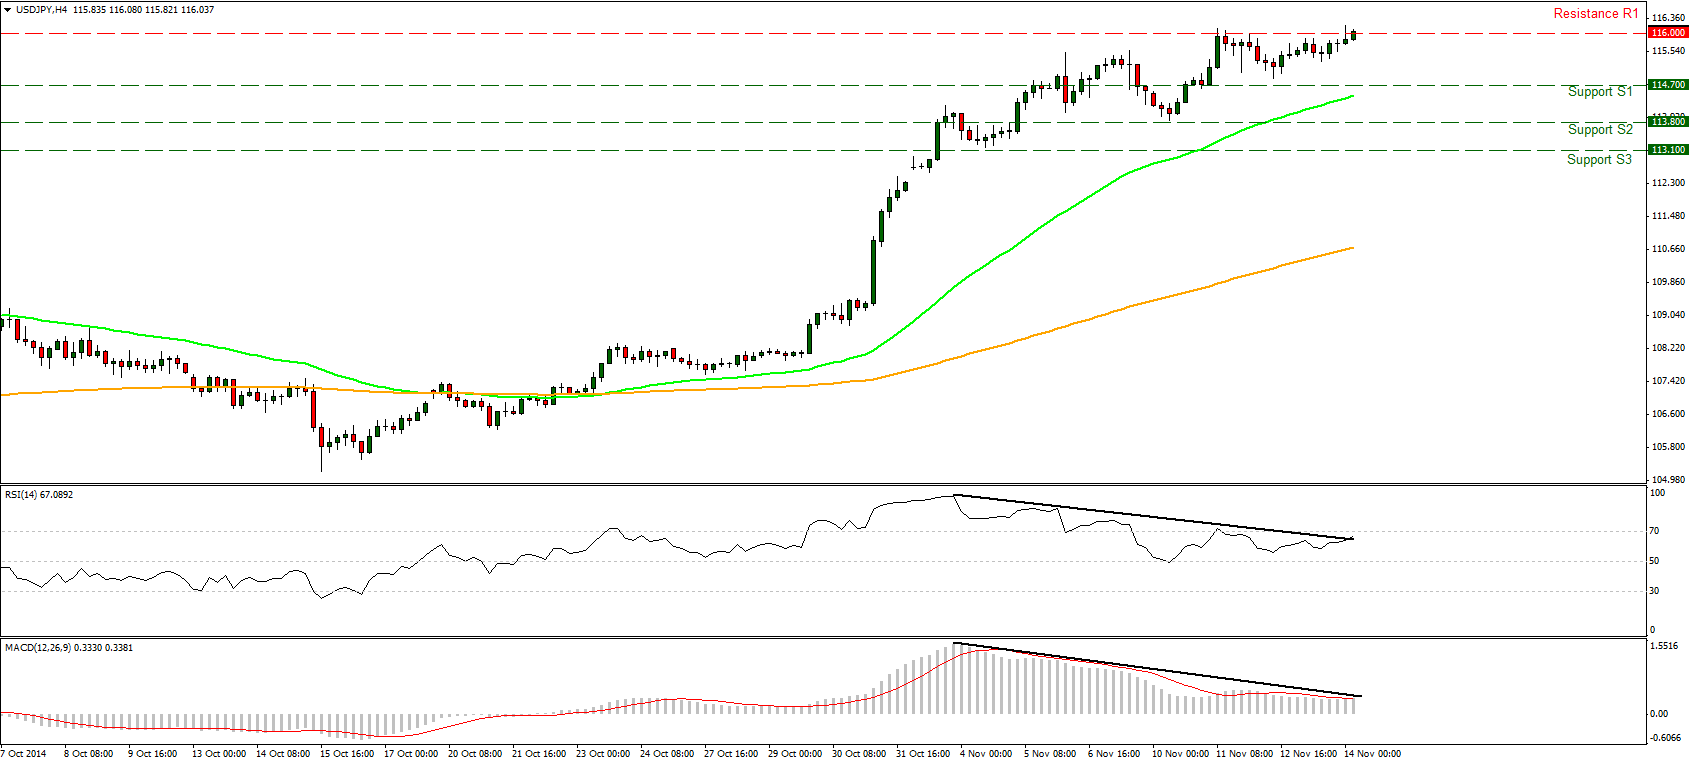
USD/JPY in a consolidative mode
USD/JPY consolidated on Thursday, staying below the 116.00 (R1) resistance line. I still see negative divergence between both of our near-term momentum studies and the price action, thus I would stay mindful of a possible pullback in the short term. The pullback could occur at least towards the 114.70 (S1) support line, which stands slightly above the 23.6% retracement level of the 29th of October – 11th of November advance. As for the broader trend, I believe that the overall outlook remains positive and I would treat any possible pullback as a corrective move before buyers prevail again. Furthermore, the daily MACD is already above its zero and trigger line and shows no signs of topping, while the 14-day RSI remains in its overbought territory. These are bullish momentum signs that suggest the rally is likely to continue.
• Support: 114.70 (S1), 113.80 (S2) 113.10 (S3).
• Resistance: 116.00 (R1), 117.00 (R2), 118.00 (R3).
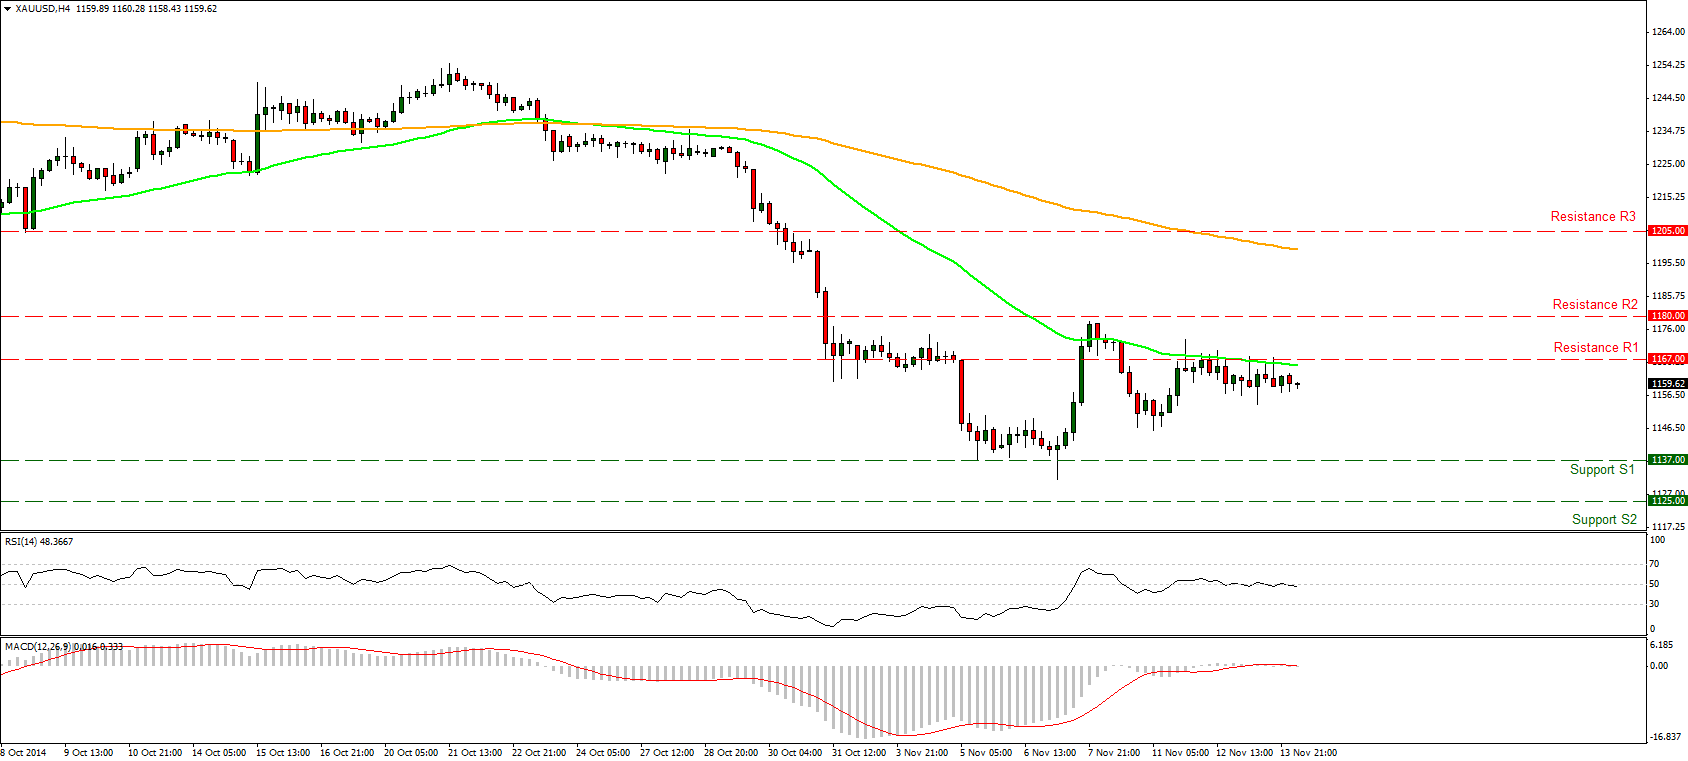
Gold steady near 1167
Gold resumed its attempts on Thursday to break our resistance line of 1167 (R1), but once again the bulls were not strong enough to push the price above that obstacle. During the early European hours, the precious metal is heading for another test of that barrier. As long as this resistance persists, I would prefer to stay on the sidelines at least for the near-term. On the daily chart, the price structure still suggests a downtrend but I will retain my view that a break below the 1137 (S1) zone is needed to get more confident for further extensions.
• Support: 1137 (S1), 1125 (S2), 1100 (S3) .
• Resistance: 1167 (R1), 1180 (R2), 1205 (R3).
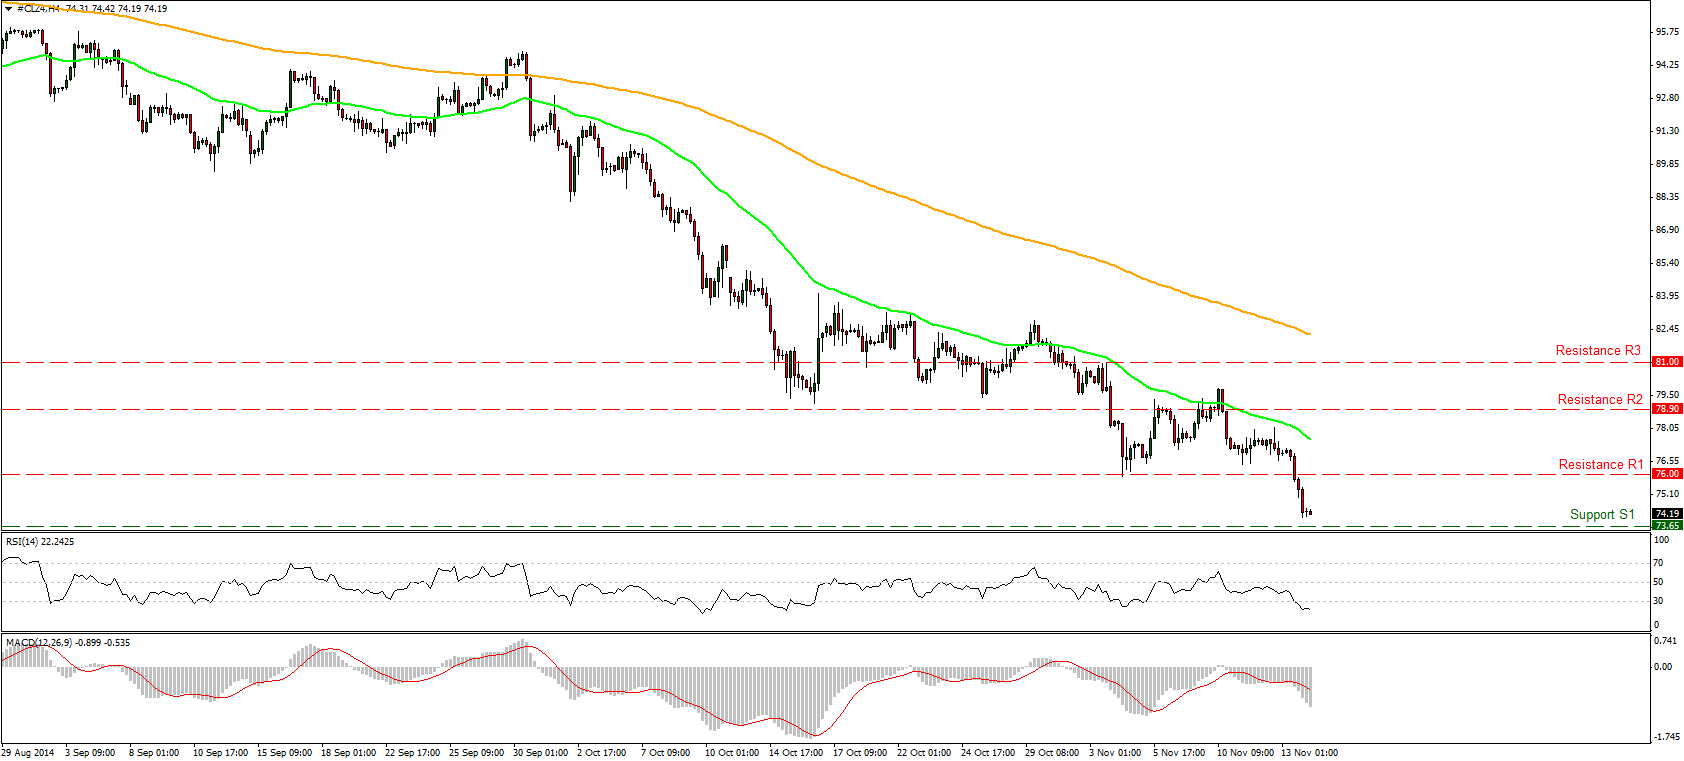
WTI plunged on Thursday
WTI plunged on Thursday, breaking two support lines in a row. The move was halted just above the 73.65 (S1) support line. A clear and decisive break of that line could trigger further extensions towards the 71.50 (S2) support level, which is defined by the low of 31st of August 2010. Looking at our momentum studies, the RSI entered its oversold field and is pointing somewhat down, while the MACD, already below its zero level, crossed its signal line and moved down. These are bearish momentum signs that suggest further declines are likely to occur. On the daily chart, the price structure remains lower highs and lower lows below both the 50- and the 200- day moving averages, keeping the overall trend to the downside.
• Support: 73.65 (S1), 71.50 (S2), 70.00 (S3) .
• Resistance: 76.00 (R1), 78.90 (R2), 81.00 (R3).

