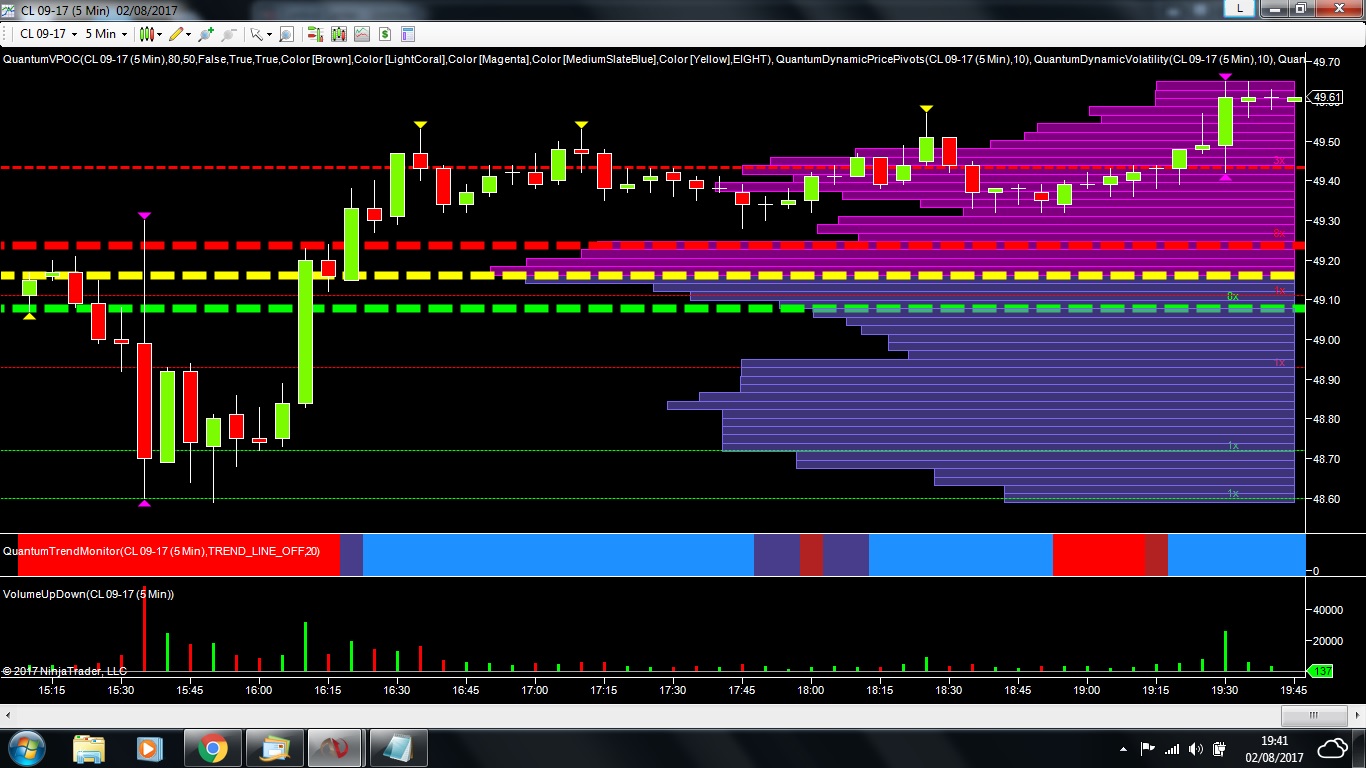
Every item of fundamental news, whether large or small, provides the big operators with the ideal opportunity to trap traders into weak positions, and yesterday’s oil inventories were no exception. But before moving to the longer term picture of the daily chart for oil, let’s start with the intraday price action of the 5 minute timeframe and the associated price action post release.
The market had been expecting a draw in oil inventories of 3.2 million barrels, but the inventory figures were less than half this number at 1.5 million and the market duly reacted lower in the first few minutes following the release.
However, as we can see on the chart, the candle formed also triggered a volatility signal, the classic precursor to a trap move, with traders stranded in weak positions to the short side, as the market duly reversed inside the spread of the candle, before reversing off the lows and continuing higher for the remainder of the session.
The volatility trap is a classic one, and is associated with all news and data driven events. Once triggered, subsequent price action is then likely to revert into the spread of the candle, with Wednesday's oil inventories providing an excellent example with many traders then forced to cover in panic as the market recovered.
Indeed, at the time of writing, a second is now forming in the $49.60 per barrel area as the market pauses towards the end of the session with the price action once again reverting inside the spread of the candle.
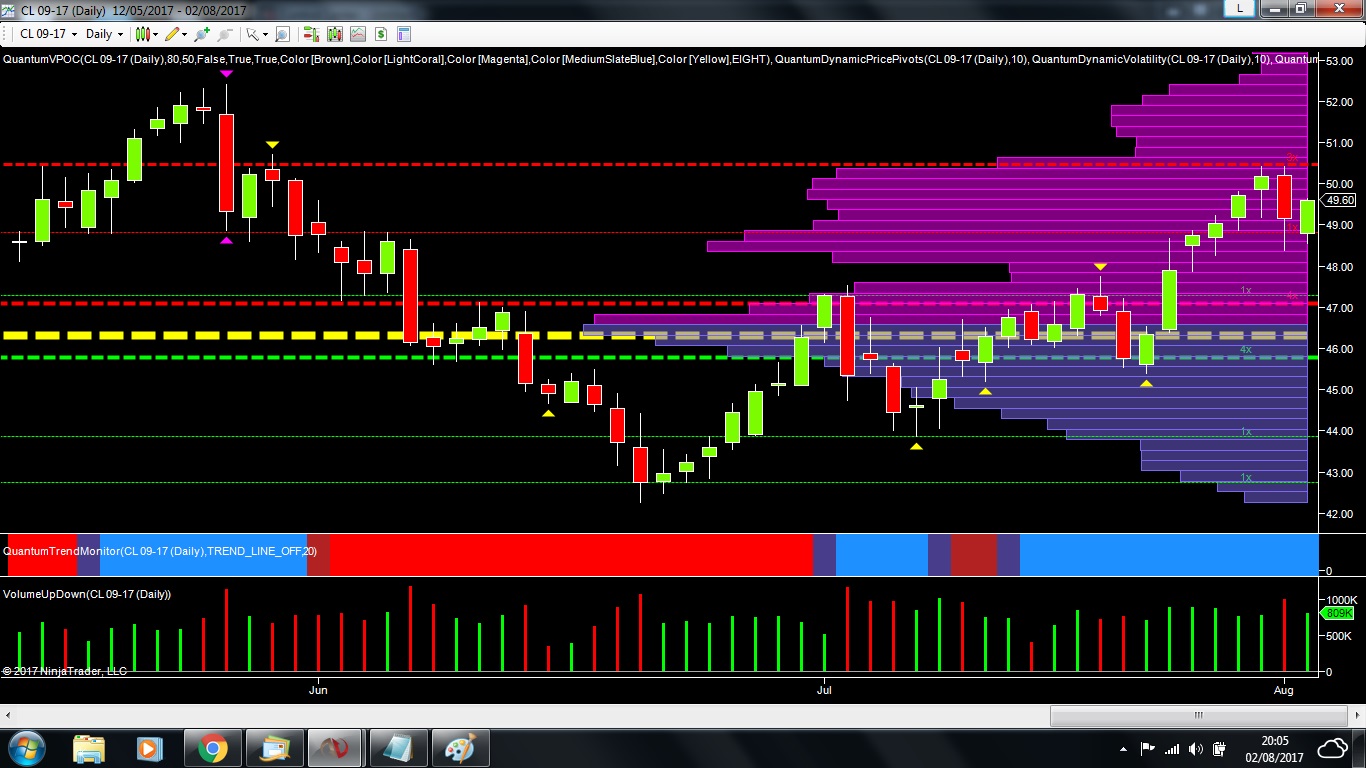
Moving to the daily chart: as always it is a question of whether it is the technical, fundamental or political aspect which is the primary driver for oil. If we start with the technical picture, the rally of late July was associated with narrow spread candles on flat and falling volumes. This suggested weakness in the market which duly arrived on Tuesday as oil failed to breach strong resistance in the $50.50 per barrel area.
This is denoted with the red dotted line which fell sharply before recovering some of the losses in Tuesday’s session from the gapped down open. The volume point of control remains anchored in the $46.30 per barrel region, and should this short term ceiling of resistance hold firm, oil may retrace back to test this region once more in the short term.
Politics continue to dominate, and despite all the rhetoric and agreements, supply still remains high, despite the modest fall in inventories yesterday. Indeed, overall, oil output rose in July to a high for the year with both Libya and Iran increasing output and so dampening the effects of Russia who continue to support the supply agreements to date.
This is occurring against a perceived backdrop of oversupply generally rising once again both in the latter half of 2017 and into 2018. As a result, oil prices continue to be contained and suppressed in the short to medium term as new fields come on stream, and those countries outside the current supply agreement continue to ramp up production.
Finally to the fundamentals: here it is the US dollar which is most pertinent, with the general weakness in the currency failing to have any noted positive impact on the price of oil, resultng in a general decoupling which has also been in evidence in other commodities.

