There should be a warning sign at 0.81 that reads: Trespassers Beware, Bears Lying Ahead. It seems that strong bearish reversals always happen after bulls failed to break the 0.81 level convincingly. We’ve seen it happening the first time in the week of 9th June, and a second time during the week of 28th July. Despite prices closing above 0.81 last week, this week was no different than the previous 2 attempts. Perhaps we should have heeded the warning signs of early week, when bullish impetus was found wanting despite last Friday’s significant breakthrough. Certainly bears did have some assistance in the form of RBNZ Govenor Wheeler’s speech which sent Kiwi dollar below 80.0 mid week, but the majority of the damage was already done when 0.81 was broken before the speech occurred, highlighting the strong bearish sentiment surrounding NZD/USD.
Weekly Chart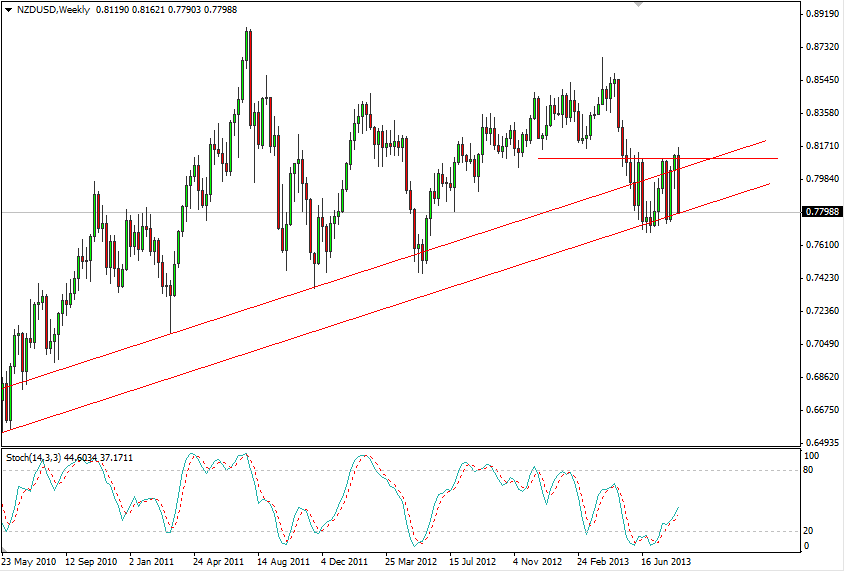 NZD/USD 1" width="580" height="392">
That being said, perhaps we need another warning sign as well that says “There Be Bulls Beyond This Line”. The multi-year Channel Bottom has been an equally if not more formidable foe against the 0.81 resistance, and the bullish push back from the trendline has been impressive in the past, and stupendous the last time it has been tested in the week of 4th August. Bears are literally standing on grounds where bulls have been seen roaming. It is likely that bulls may be enraged by the big red candle that is encroaching on its territory, resulting in strong bullish rebound next week. Stochastic readings also agree on such a scenario with readings continue to to push higher, barely tapering lower despite the strong sell-off this week.
Hourly Chart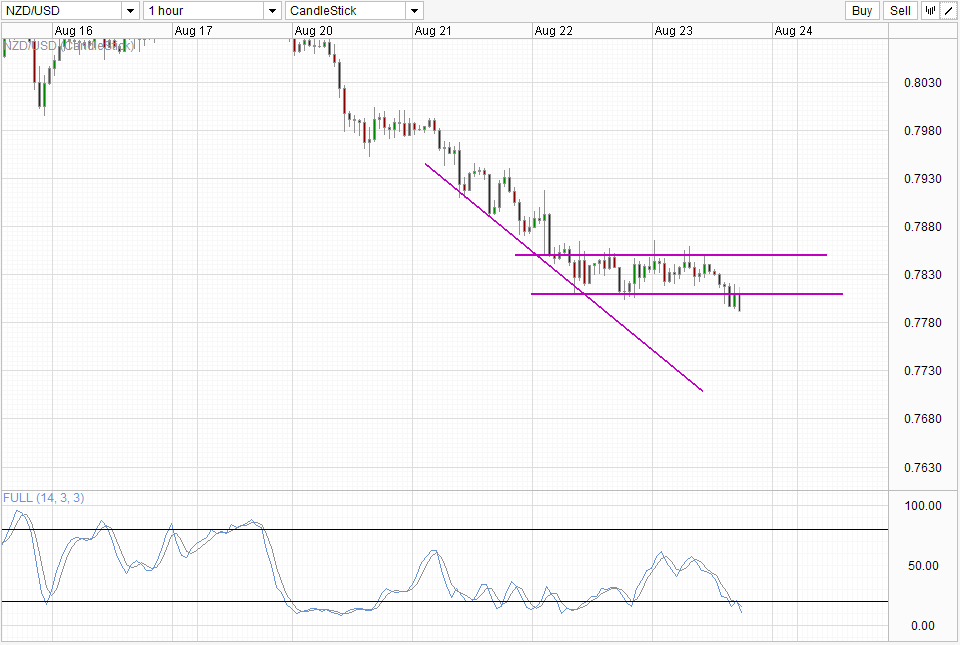 NZD/USD 2" width="580" height="389">
However, short-term charts suggest that bearish momentum is still continuing strong. We’ve just seen price breaking the short-term consolidation between 0.781 – 0.785, suggesting that more bearish movement can be expected especially since the recovery post breakout failed to climb back above 0.781. Currently price is also below the 0.78 round figure, piling further pressure lower. The only “bullish” sign is the fact that Stochastic readings are Oversold. However, readings are still pointing lower, and it is widely known that short-term counter-trend stochastic signals tended not to be reliable when broad trends are pointing the other way.
With that in mind, next week’s opening price action becomes key in helping us to determine whether a recovery back towards 0.81 is likely. If we do not see any strong bullish reaction on Monday, the chances of further rally back into the Channel will be diminished. In similar vein, should price manage to close below Channel Bottom but we do not see continued bearish pressure on Monday, we could see a repeat of this week in opposite direction.
Original post
- English (UK)
- English (India)
- English (Canada)
- English (Australia)
- English (South Africa)
- English (Philippines)
- English (Nigeria)
- Deutsch
- Español (España)
- Español (México)
- Français
- Italiano
- Nederlands
- Português (Portugal)
- Polski
- Português (Brasil)
- Русский
- Türkçe
- العربية
- Ελληνικά
- Svenska
- Suomi
- עברית
- 日本語
- 한국어
- 简体中文
- 繁體中文
- Bahasa Indonesia
- Bahasa Melayu
- ไทย
- Tiếng Việt
- हिंदी
NZD/USD: Strong Bearish Sentiment
Published 08/23/2013, 07:19 AM
Updated 07/09/2023, 06:31 AM
NZD/USD: Strong Bearish Sentiment
3rd party Ad. Not an offer or recommendation by Investing.com. See disclosure here or
remove ads
.
Latest comments
Install Our App
Risk Disclosure: Trading in financial instruments and/or cryptocurrencies involves high risks including the risk of losing some, or all, of your investment amount, and may not be suitable for all investors. Prices of cryptocurrencies are extremely volatile and may be affected by external factors such as financial, regulatory or political events. Trading on margin increases the financial risks.
Before deciding to trade in financial instrument or cryptocurrencies you should be fully informed of the risks and costs associated with trading the financial markets, carefully consider your investment objectives, level of experience, and risk appetite, and seek professional advice where needed.
Fusion Media would like to remind you that the data contained in this website is not necessarily real-time nor accurate. The data and prices on the website are not necessarily provided by any market or exchange, but may be provided by market makers, and so prices may not be accurate and may differ from the actual price at any given market, meaning prices are indicative and not appropriate for trading purposes. Fusion Media and any provider of the data contained in this website will not accept liability for any loss or damage as a result of your trading, or your reliance on the information contained within this website.
It is prohibited to use, store, reproduce, display, modify, transmit or distribute the data contained in this website without the explicit prior written permission of Fusion Media and/or the data provider. All intellectual property rights are reserved by the providers and/or the exchange providing the data contained in this website.
Fusion Media may be compensated by the advertisers that appear on the website, based on your interaction with the advertisements or advertisers.
© 2007-2024 - Fusion Media Limited. All Rights Reserved.