June's AI-picked stock updates now live. See what's new in Tech Titans, up 28.5% year to date.Unlock Stocks

Nvidia: Correction Is Near

Published 12/08/2017, 11:01 AM
Updated 03/09/2019, 08:30 AM
INTC
-
NVDA
-
AMD
-
SMH
-
XLK
-

The American semiconductors company NVIDIA Corporation (NASDAQ:NVDA) specializes in designing graphics processing units (GPUs) for the gaming, cryptocurrency and professional markets, as well as its system on a chip units (SoCs) for the mobile computing and automotive market.

Nvidia is considered as one of the strongest technology companies this year and its stock NVDA enjoyed a great rally this year despite the recent 15% pullback. If we compare NVDA performance for this year to its main competitors Intel (NASDAQ:INTC) and Advanced Micro Devices (NASDAQ:AMD) then we can notice how strong the company has been this year, as well as outperforming both the Technology Select Sector SPDR ETF (NYSE:XLK), which is the best performer sector for 2017, and The VanEck Vectors Semiconductor ETF (NYSE:SMH), which contains the mega-cap semiconductors companies.
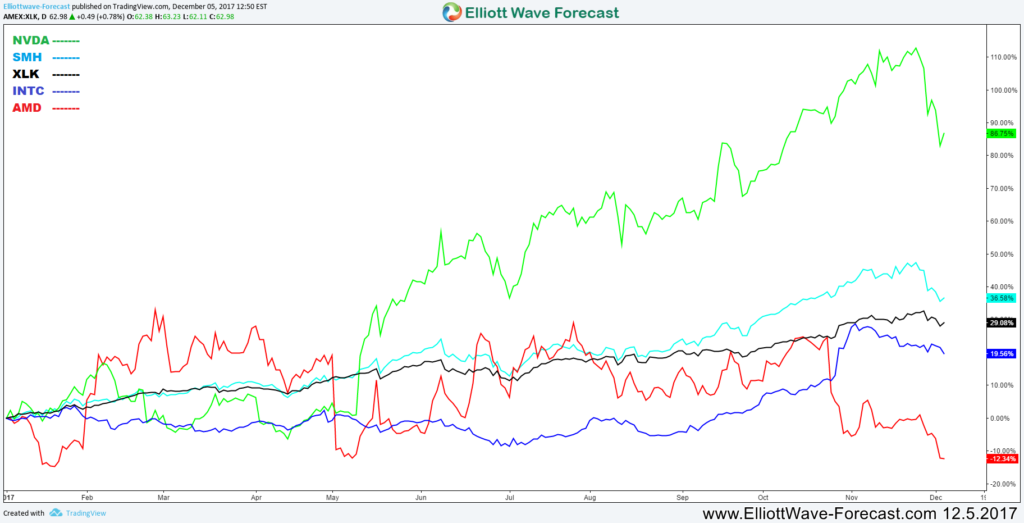
The Semiconductor Landscape

To understand the current situation for the Stock, we’ll explain the technical chart using Elliott Wave Theory and present 2 possible scenarios that could be taking place by the end of this year:

1st Scenario
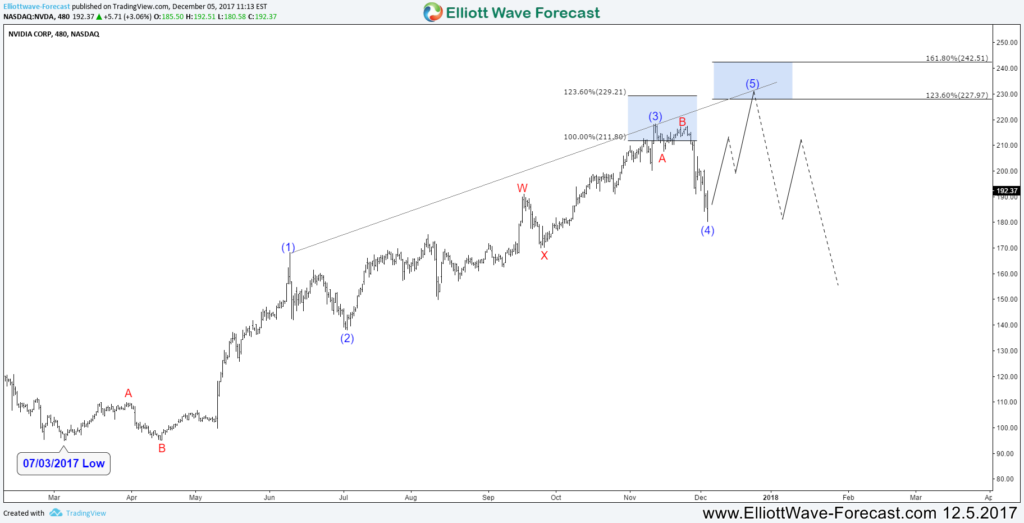
NVDA Ending Diagonal

In the chart above, we are presenting the cycle from July low as 5 waves ending diagonal structure which is still incomplete. The move is missing another leg higher toward extreme area $227 – $242 where the stock will be expected to end that cycle and start a 3 waves correction at least.

2nd Scenario
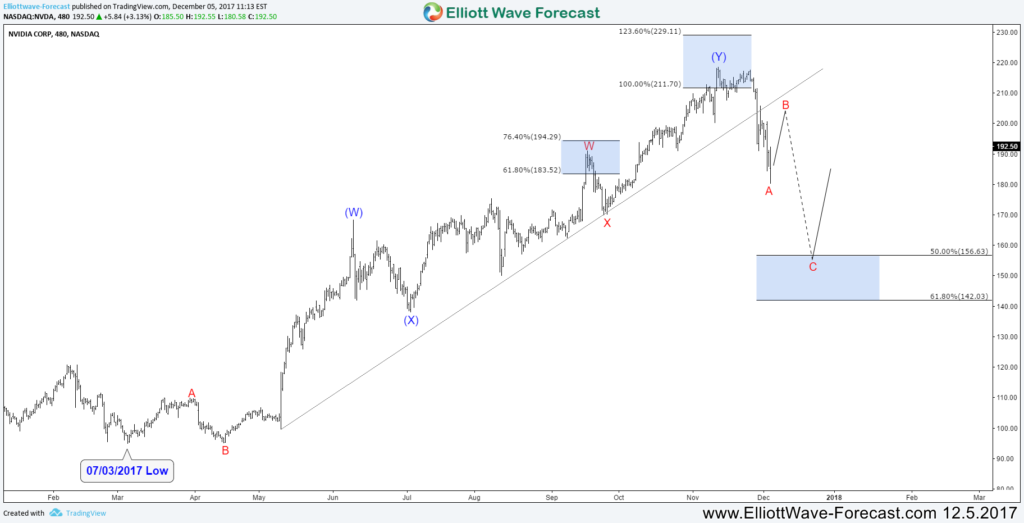
NVDA Double Three

In the second chart, we are considering the cycle from July low completed as 7 swings double three structure after it reached equal legs area $211 – $229. Therefore the stock already started the correction lower with the first leg taking place during the recent decline. In this case, NVDA short term bounce is expected to fail below the recent $218 peak to be able to extend the correction lower toward the 50%-61.8% Fibonacci retracement of the rally around $156 – $142 area.

Conclusion

Nvidia short term analysis is suggesting a correction to take place either after making new all time highs or the pullback is already in progress. Consequently buyers need to be careful during the next period and it would be wise to wait for a clear corrective structure to take place before re-entering the long side.

Latest comments

Loading next article…
Risk Disclosure: Trading in financial instruments and/or cryptocurrencies involves high risks including the risk of losing some, or all, of your investment amount, and may not be suitable for all investors. Prices of cryptocurrencies are extremely volatile and may be affected by external factors such as financial, regulatory or political events. Trading on margin increases the financial risks.
Before deciding to trade in financial instrument or cryptocurrencies you should be fully informed of the risks and costs associated with trading the financial markets, carefully consider your investment objectives, level of experience, and risk appetite, and seek professional advice where needed.
Fusion Media would like to remind you that the data contained in this website is not necessarily real-time nor accurate. The data and prices on the website are not necessarily provided by any market or exchange, but may be provided by market makers, and so prices may not be accurate and may differ from the actual price at any given market, meaning prices are indicative and not appropriate for trading purposes. Fusion Media and any provider of the data contained in this website will not accept liability for any loss or damage as a result of your trading, or your reliance on the information contained within this website.
It is prohibited to use, store, reproduce, display, modify, transmit or distribute the data contained in this website without the explicit prior written permission of Fusion Media and/or the data provider. All intellectual property rights are reserved by the providers and/or the exchange providing the data contained in this website.
Fusion Media may be compensated by the advertisers that appear on the website, based on your interaction with the advertisements or advertisers.
© 2007-2024 - Fusion Media Limited. All Rights Reserved.