
Gold mining giant, Newmont Mining Corporation (NYSE:NEM) reported third-quarter 2016 adjusted earnings including Batu Hijau results of 51 cents per share, a more than two-fold surge from 23 cents earned in the year-ago quarter. Earnings were in line with the Zacks Consensus Estimate.
On a reported basis, the company posted net income from continuing operations (excluding Batu Hijau results) of $169 million or 32 cents per share, a roughly 6.3% rise from net earnings of $159 million or 30 cents per share recorded a year ago.
Newmont's revenues of $1,791 million jumped 14.8% from $1,560 million in the year-ago quarter owing to improved gold pricing. However, revenues missed the Zacks Consensus Estimate of $1,984 million.
In third-quarter 2016, average net realized gold price was $1,329 per ounce, reflecting a year-over-year increase of 20%. The average net realized copper price was $2.04 per pound, representing a year-over-year increase of 3.6%.
Newmont's attributable gold production rose roughly 3.3% year over year to 1.25 million ounces, with increases at Cripple Creek & Victor, Carlin and Boddington that more than compensated declining production at Yanacocha. Attributable copper production was 15,000 tons in the quarter which was at par with the year-ago quarter.
Costs applicable to sales (“CAS”) were $706 per ounce for gold, slumping 23.7% year over year. Copper CAS was $2.14 per pound, an increase of 20.2% year over year. Third-quarter gold CAS per ounce was negatively impacted by inventory adjustments particularly at Yanacocha and Ahafo, and copper CAS by unfavorable inventory adjustments at Phoenix.
All-in sustaining costs (“AISC”) of $925 per ounce for gold increasing roughly 5.2% year over year while $2.57 per pound for copper were up roughly 16.3% year over year. AISC improved over the prior-year period due to CAS improvements.
Regional Performance
North America
Attributable gold production in North America in the third quarter was 540,000 ounces, rising 24% year over year. Consolidated copper production was at par with the year-ago quarter, at 5,000 tons.
Gold CAS for this region was $678 per ounce, down 10%, and copper CAS was $3.44 per pound, soaring 76%.
South America
Attributable gold production in South America was 75,000 ounces, plunging 40% year over year. Gold CAS for this region climbed 64% year over year to $1,022 per ounce.
Asia Pacific
Attributable gold and copper production in the Asia Pacific region was 429,000 ounces, dipping 5% year over year, and 10,000 tons, at par with the year ago quarter, respectively. Gold and copper CAS for this region was $598 per ounce, up 1%, and $1.56 per pound, down 6%, respectively.
Africa
The region produced 202,000 ounces of gold in the reported quarter, up 5% year over year. Gold CAS was $778 per ounce increasing 43% year over year.
Financial Position
Net cash provided by continuing operating activities was $509 million in the third quarter, compared with $475 million in the prior-year quarter mainly due to improved gold pricing.
The sale of Newmont’s 48.5% interest in PTNNT, which operates the Batu Hijau mine in Indonesia, is anticipated to close in the fourth quarter. Including this transaction, Newmont would have generated attributable cash proceeds of $2.8 billion from asset sales since 2013 while maintaining steady attributable gold production of roughly 5 million ounces a year.
Project Update
Expansion at Cripple Creek & Victor (CC&V) includes a new leach pad, recovery plant and mill. In 2016 gold production is expected to be in the range of 350,000–400,000 ounces at CAS of between $500–$550 per ounce and AISC of between $600–$650 per ounce.
The Merian project started commercial production on Oct 1, 2016, and was completed on time and more than $150 million lower than initial development capital budget. Gold production is anticipated to be between 400,000–500,000 ounces (on a 100% basis) annually during the first five years at CAS of between $575–$675 per ounce and AISC of between $650 and $750 per ounce.
At Long Canyon, Phase 1 is currently being commissioned and the mine is expected to reach commercial production in fourth-quarter 2016.
Outlook
Newmont anticipates attributable gold production to be in the range of 4.8–5 million ounces in 2016. Increased production at CC&V, Tanami, Merian and Long Canyon is anticipated to compensate the impacts of maturing operations at Yanacocha and the sale of Batu Hijau.
Attributable copper production is forecast to be between 40,000–60,000 tons in 2016, with stable production expected at Phoenix and Boddington.
CAS is estimated to be between $640–$690 per ounce in 2016, an increase from the previous guidance range of $630–$680 per ounce. 2016 CAS outlook was unfavorably impacted by inventory adjustments at Ahafo and geotechnical issues at an open pit mine at Carlin.
AISC is expected to be between $870 and $930 per ounce in 2016, at par with the earlier guidance.
Copper CAS is expected to be between $1.90 and $2.10 per pound, and copper AISC is expected to be between $2.30 and $2.50 per pound in 2016.
Capital forecast for 2016 has been reduced and is expected to be between $970 million and $1.2 billion. This includes sustaining capital expenditure of between $550 million and $600 million.
Depreciation in 2016 is expected in the range of $1.2–$1.3 billion, up from prior view of $1.1–$1.2 billion. Tax rate is anticipated to be between 30–34% after fully adjusting for the exclusion of Indonesian taxable income.
Newmont expects to pay around $260–$280 million of interest expense in 2016. So far in 2016, Newmont has cut consolidated debt by more than $1.1 billion, including $330 million from the PTNNT credit facility. The company remains on track to exceed its debt repayment target of between $800 million and $1.3 billion by 2018.
NEWMONT MINING Price, Consensus and EPS Surprise
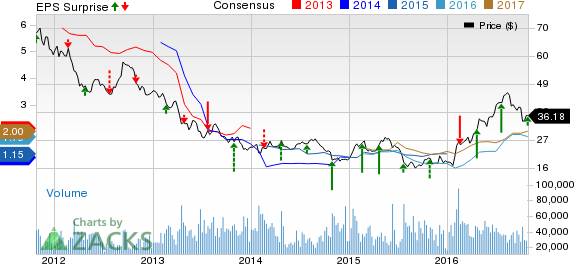
NEWMONT MINING Price, Consensus and EPS Surprise | NEWMONT MINING Quote
Zacks Rank
Newmont currently carries a Zacks Rank #2 (Buy).
Some similarly-ranked companies in the mining space include New Gold Inc. (TO:NGD) , B2Gold Corp. (NYSE:BTG) and Pershing Gold Corporation (NASDAQ:PGLC) all carrying a Zacks Rank #2. You can see the complete list of today’s Zacks #1 (Strong Buy) Rank stocks here.
New Gold has an expected earnings growth rate of 416.7% for the current year.
B2Gold has an expected earnings growth rate of 1,125% for the current year.
Pershing Gold has an expected earnings growth rate of 26.3% for the current year.
Confidential from Zacks
Beyond this Analyst Blog, would you like to see Zacks' best recommendations that are not available to the public? Our Executive VP, Steve Reitmeister, knows when key trades are about to be triggered and which of our experts has the hottest hand. Click to see them now>>
NEWMONT MINING (NEM): Free Stock Analysis Report
NEW GOLD INC (NGD): Free Stock Analysis Report
PERSHING GLD (NYSE:GLD) CP (PGLC): Free Stock Analysis Report
B2GOLD CORP (BTG): Free Stock Analysis Report
Original post