Henry Hub Natural Gas Prices traded lower despite stronger economic activities in the US as indicated by yesterday’s economic news releases. Natural Gas prices tend to be insensitive to risk appetite, but on a day that saw Crude prices rallying despite a lower than expected implied demand, it is strange that there wasn’t any form of bullish response. Granted that latest storage data from the Energy Information Administration (EIA) suggest that implied demand for Natural Gas is low, but even so the difference in expectation was only 3B cubic feet. Comparing this to the rest of 2013, in which we had 13 separate weeks of disappointments, the average was 8.5B cubic feet, more than twice that of this week. This is not saying that we do not have a good reason for yesterday’s sell-off, but that the sell-off was too aggressive.
Another interpretation may say that overall sentiment has been bearish, but that notion does not fly given that Nat Gas prices have been steadily building up over the past 4 days before the faithful break. Nonetheless this assertion isn’t without merit either, as global Natural Gas prices is expected to fall due to US production increasing, but it is hard to weave that into the short-term narrative especially given that price is on an uptrend since the lows of April 2012 (see weekly chart below).
Hourly Chart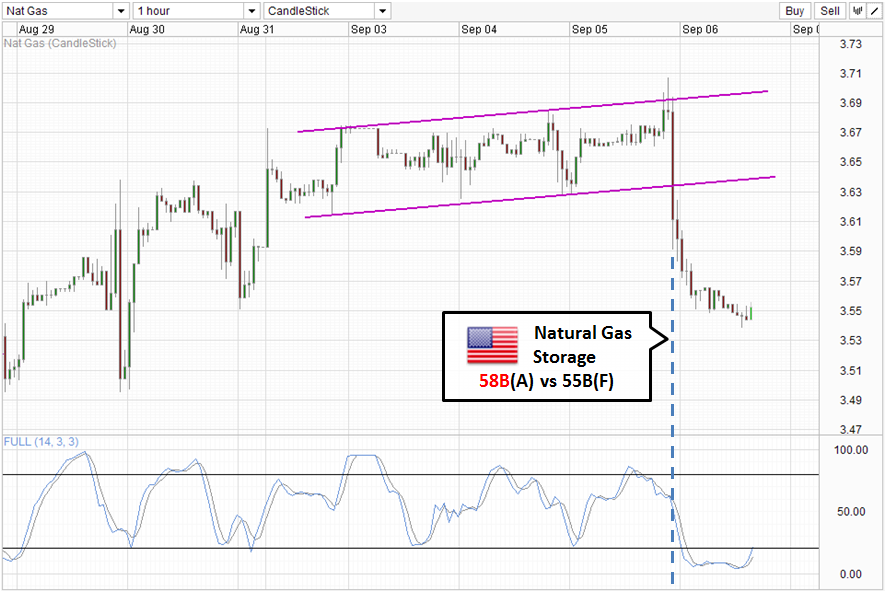
Perhaps the best explanation here would be technicals once again. Prices were already looking a tad bearish given that we were trading at the ceiling of the incumbent Channel. Hence there was an additional bearish push beyond the lower implied demand yesterday, which unfortunately allowed price to break Channel Bottom – resulting in more bearish technical traders playing the breakout for a move towards 3.55. Currently Stochastic readings is peaking out of the Oversold region, and potentially giving us a bullish cycle signal. 1st bullish target would be 3.60, but ultimately bulls should seek to retake the Channel once again, assuming that sentiment is actually still bullish. If price is unable to breach above 3.60, the likelihood of sentiment remaining bearish increases, and we could see price returning back to 3.55 and perhaps 3.50, which is the lows of 29th Aug.
Weekly Chart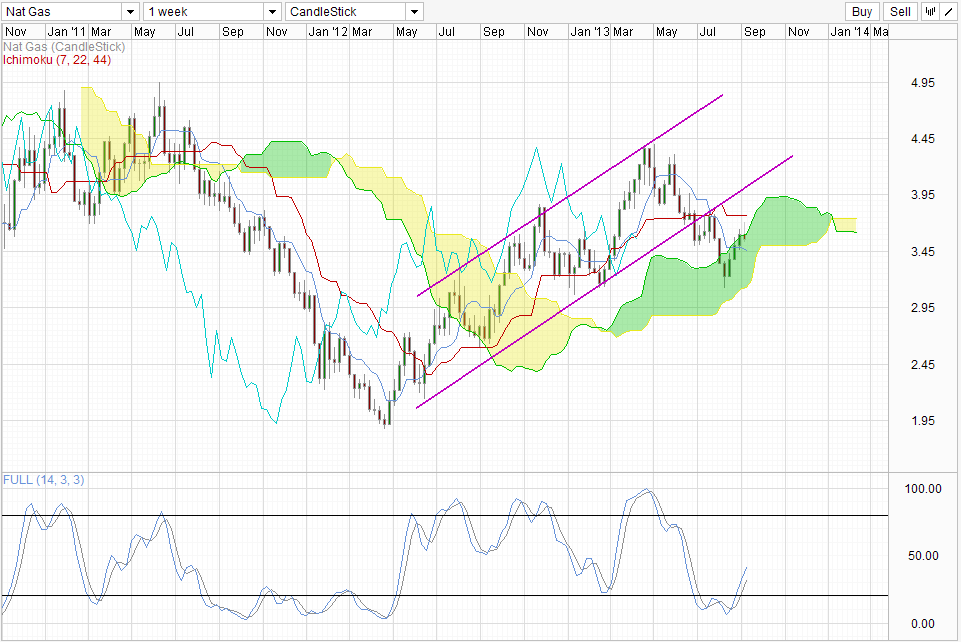
Weekly Chart show mixed bias. Prices appear to be finding resistance from Senkou Span A, which opens the possibility that price would head back towards Senkou Span B which is around 3.12-3.13, close to the lows of 8th August. However, Stochastic readings is showing a bullish cycle signal, which suggest that price should be pushing higher. We may actually be able to see price pushing higher yet staying under the Senkou Span A, thus not invalidating the bearish pressure resulting from the breakout of rising Channel. As such, traders expecting the rebound of Kumo Senkou Span A may be opening themselves for higher risk with reasonable stop losses further than usual. A better bearish confirmation may be the break of Senkou Span B which will coincide with a break of support of 3.12-3.13, opening up a long-term bearish push towards sub 2.00 levels. It is also likely that Stochastic readings will reversed by then, and hence we will be in a good position where both indicators agree on a bearish bias, instead of current ambiguity.
Original post
- English (UK)
- English (India)
- English (Canada)
- English (Australia)
- English (South Africa)
- English (Philippines)
- English (Nigeria)
- Deutsch
- Español (España)
- Español (México)
- Français
- Italiano
- Nederlands
- Português (Portugal)
- Polski
- Português (Brasil)
- Русский
- Türkçe
- العربية
- Ελληνικά
- Svenska
- Suomi
- עברית
- 日本語
- 한국어
- 简体中文
- 繁體中文
- Bahasa Indonesia
- Bahasa Melayu
- ไทย
- Tiếng Việt
- हिंदी
Natural Gas: No Clear Bearish Mandate Despite Yesterday’s Sell
Published 09/06/2013, 07:39 AM
Updated 07/09/2023, 06:31 AM
Natural Gas: No Clear Bearish Mandate Despite Yesterday’s Sell
3rd party Ad. Not an offer or recommendation by Investing.com. See disclosure here or
remove ads
.
Latest comments
Install Our App
Risk Disclosure: Trading in financial instruments and/or cryptocurrencies involves high risks including the risk of losing some, or all, of your investment amount, and may not be suitable for all investors. Prices of cryptocurrencies are extremely volatile and may be affected by external factors such as financial, regulatory or political events. Trading on margin increases the financial risks.
Before deciding to trade in financial instrument or cryptocurrencies you should be fully informed of the risks and costs associated with trading the financial markets, carefully consider your investment objectives, level of experience, and risk appetite, and seek professional advice where needed.
Fusion Media would like to remind you that the data contained in this website is not necessarily real-time nor accurate. The data and prices on the website are not necessarily provided by any market or exchange, but may be provided by market makers, and so prices may not be accurate and may differ from the actual price at any given market, meaning prices are indicative and not appropriate for trading purposes. Fusion Media and any provider of the data contained in this website will not accept liability for any loss or damage as a result of your trading, or your reliance on the information contained within this website.
It is prohibited to use, store, reproduce, display, modify, transmit or distribute the data contained in this website without the explicit prior written permission of Fusion Media and/or the data provider. All intellectual property rights are reserved by the providers and/or the exchange providing the data contained in this website.
Fusion Media may be compensated by the advertisers that appear on the website, based on your interaction with the advertisements or advertisers.
© 2007-2024 - Fusion Media Limited. All Rights Reserved.