Get 40% Off
👀 👁 🧿 All eyes on Biogen, up +4,56% after posting earnings. Our AI picked it in March 2024.
Which stocks will surge next?
Unlock AI-picked Stocks

Natural Gas In Uptrend, Resistance In 293-295 Range

Published 04/21/2014, 06:11 AM
Updated 05/14/2017, 06:45 AM


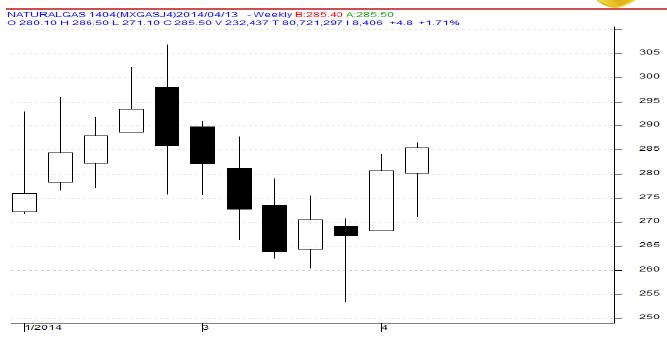
MCX Natural Gas April as seen in the weekly chart above has opened the week at 280.10 levels during this period prices has made a low of 271.10 levels. As expected in the end of the week prices bounced back from the support level towards the high of 286.50 levels. During this week prices able to close above the previous week’s closing of 280.70 levels and finally closed 1.17% higher on 285.50 levels. As per the price formation, during this week prices formed “Bullish Candlestick” pattern which indicates bullishness.

For the next week we expect Natural Gas prices to find support in the range of 275 - 273 levels. Trading consistently below 273 levels would lead towards the strong support at 268 levels.

Resistance is now observed in the range of 293 - 295 levels. Trading consistently above 295 levels would lead towards the strong resistance at 300 levels, and then finally towards the major resistance at 305 levels.

MCX / NYMEX Natural Gas Trading levels for the week

Trend: Up
S1 - 273 / $ 4.50 R1 - 295 / $ 4.90
S2 - 268 / $ 4.30 R2 - 305 / $ 5.10

Weekly Recommendation: Buy MCX Natural Gas April between 273 - 278, SL - 268, Target – 290 / 295.

Latest comments

Risk Disclosure: Trading in financial instruments and/or cryptocurrencies involves high risks including the risk of losing some, or all, of your investment amount, and may not be suitable for all investors. Prices of cryptocurrencies are extremely volatile and may be affected by external factors such as financial, regulatory or political events. Trading on margin increases the financial risks.
Before deciding to trade in financial instrument or cryptocurrencies you should be fully informed of the risks and costs associated with trading the financial markets, carefully consider your investment objectives, level of experience, and risk appetite, and seek professional advice where needed.
Fusion Media would like to remind you that the data contained in this website is not necessarily real-time nor accurate. The data and prices on the website are not necessarily provided by any market or exchange, but may be provided by market makers, and so prices may not be accurate and may differ from the actual price at any given market, meaning prices are indicative and not appropriate for trading purposes. Fusion Media and any provider of the data contained in this website will not accept liability for any loss or damage as a result of your trading, or your reliance on the information contained within this website.
It is prohibited to use, store, reproduce, display, modify, transmit or distribute the data contained in this website without the explicit prior written permission of Fusion Media and/or the data provider. All intellectual property rights are reserved by the providers and/or the exchange providing the data contained in this website.
Fusion Media may be compensated by the advertisers that appear on the website, based on your interaction with the advertisements or advertisers.
© 2007-2024 - Fusion Media Limited. All Rights Reserved.