I am in a good mood today (don’t worry, I am sure I’ll get over it) so I am going to make it easy for the people with short attention spans: August, September and October. That is the answer to the title above. If you would like just a little more information please keep reading.
First off, please note that the title says “Months to Beware of” and NOT “Months that are absolutely, positively guaranteed to witness stock market Armageddon!” Here it is in a nutshell:
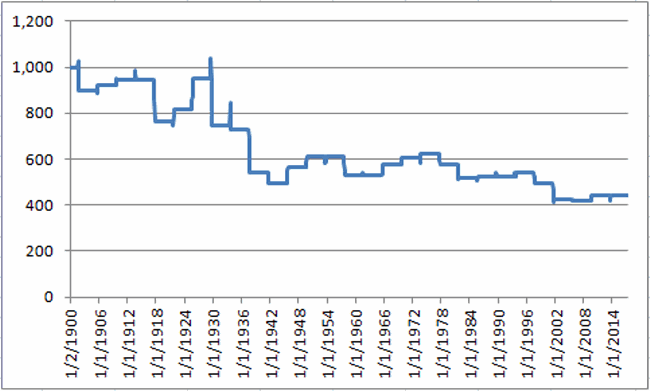
In terms of the election cycle we are in a post-election year. Figure 1 displays the cumulative growth of $1,000 invested in the Dow since 1900 ONLY during August through October of post-election years.

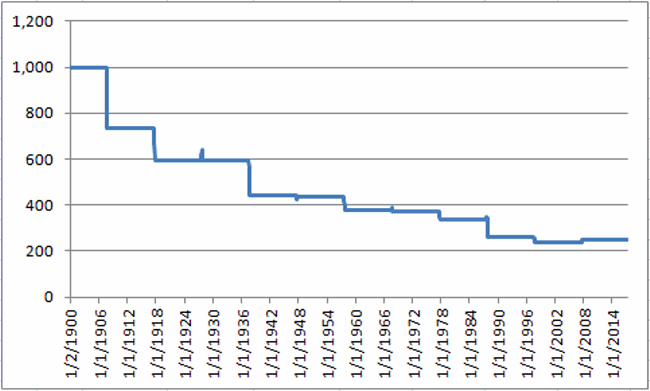
In terms of the decennial pattern we are in Year 7 of the current decade. Figure 2 displays the cumulative growth of $1,000 invested in the Dow since 1900 ONLY during August through October of Years ending in “7”. Note that 2007 was the first “7” year to actually show a August through October gain.

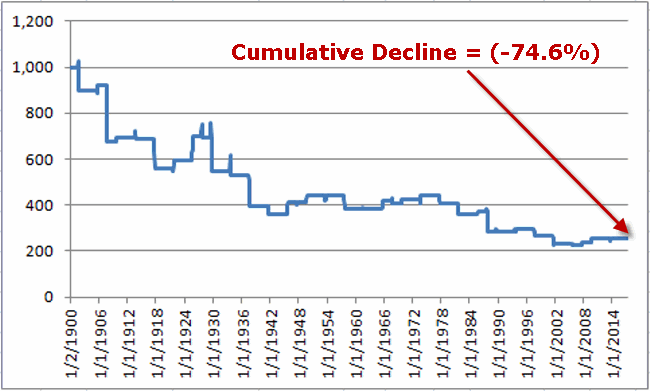
Figure 3 displays the cumulative growth of $1,000 invested in the Dow since 1900 ONLY during August through October during all post-election and/or Years ending in “7”.

As you can see the long-term cumulative results are pretty awful. That’s the bad news and the reason caution may be in order during August through October of this year. But the good news is that the results are not “uniformly awful.”
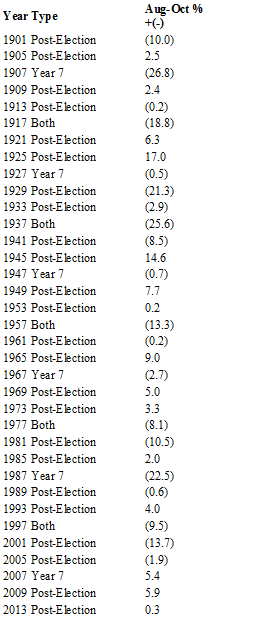
Figure 4 below list the year-by-year results for all relevant years. But in sum there are have 35 years that were either post-election, ending in “7”, or both:
- # times showing a gain = 15 (43% of the time)
- # of times showing a loss = 20 (57% of the time)
- Average gain = +5.7%
- Average loss = (-9.9%)
In sum, while the results in Figure 3 appear to be pretty unrelentingly bad, the reality is that reality is that 43% of the years that appear in Figure 4 below actually showed a gain.
So the watchword as we get closer to August will be “Caution” and not “Fear” nor “Panic”.

Figure 4 – Year-by-Year Results for Aug/Sep/Oct during Post-Election years and Years ending in “7”
Disclaimer: The data presented herein were obtained from various third-party sources. While I believe the data to be reliable, no representation is made as to, and no responsibility, warranty or liability is accepted for the accuracy or completeness of such information. The information, opinions and ideas expressed herein are for informational and educational purposes only and do not constitute and should not be construed as investment advice, an advertisement or offering of investment advisory services, or an offer to sell or a solicitation to buy any security.
