Last week we argued that the underperformance of the gold miners during Gold’s rebound was a bad sign. Since then the miners have plunged to new lows while Gold appears to be at the doorstep of a major breakdown below $1180. It shouldn’t be a surprise as it would simply be following the miners and Silver. The current bear market is getting very long in the tooth but it is not yet over. We see more losses ahead before a potential lifetime buying opportunity.
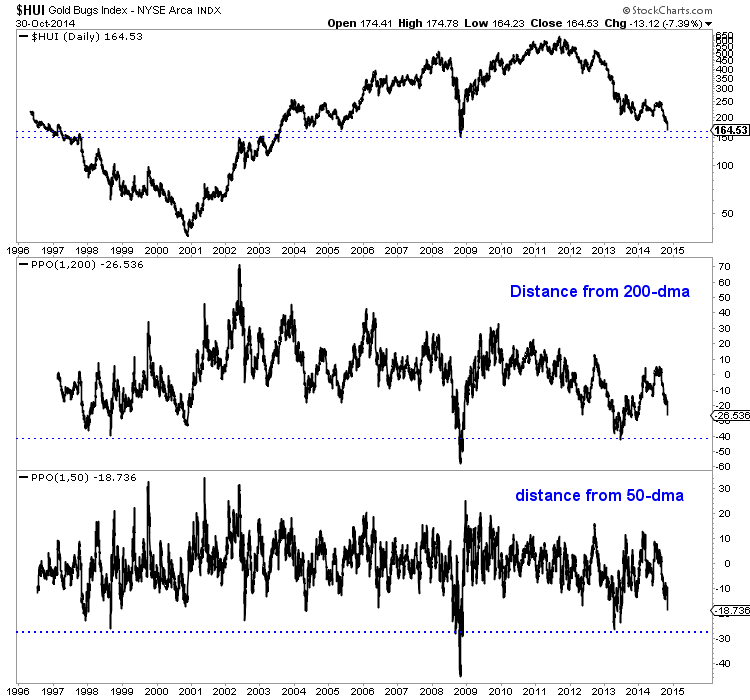
The HUI Gold Bugs Index is obviously very oversold but its not yet at strong support. It closed Thursday at 164 but should fall another 9% to support at 150. Currently the HUI is 26% below its 200-day exponential moving average and 19% below its 50-day moving average. The chart argues that those figures need to reach 40% and 27% before we deem the oversold condition extreme. If the HUI trades below 150 then it would mark an 11-year low. That is extreme.

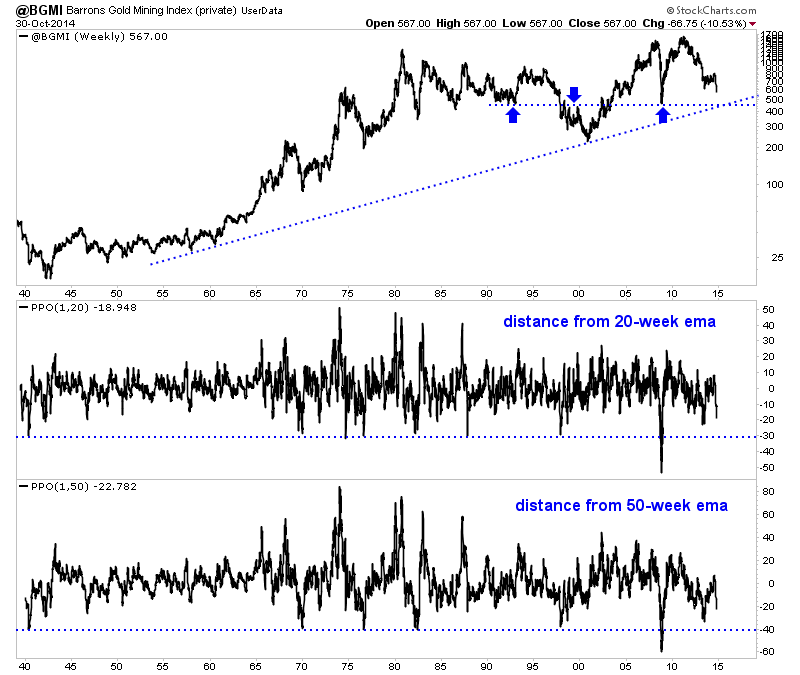
Nick Laird of ShareLynx provided me data from the Barron’s Gold Mining Index (BGMI), which I uploaded to stockcharts.com. This index dates back to 1938 and allows for greater historical perspective. Data is updated weekly so I had to estimate the current price. The HUI, XAU and (ARCA:GDX) are all down 10% or 11% on the week so I calculated a 10.5% loss on the week which is a price of 567. Lateral support, which dates back to the early 1990s as well as trendline support that dates back 50 years provide a strong confluence of support in the mid 400s. That is roughly 20% downside.

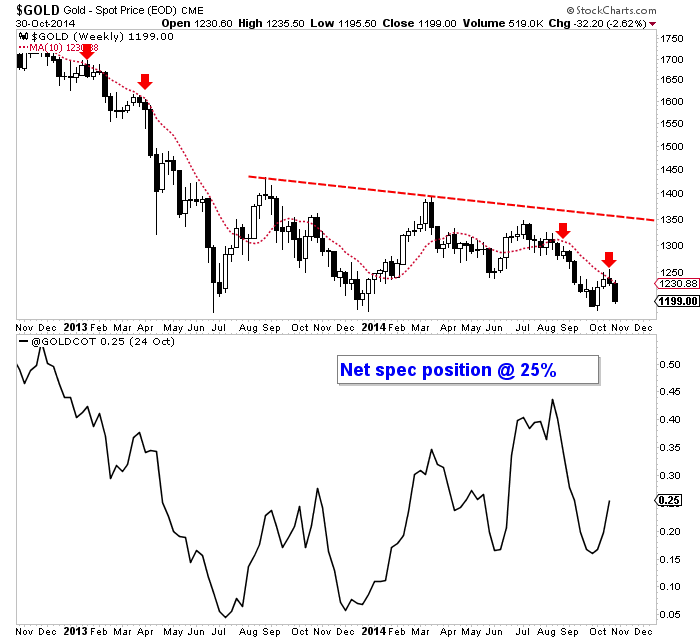
Another reason to expect more downside is Gold hasn’t even broken $1180 yet, though it may have by the time you read this. The price action has been textbook bearish. Gold failed to rally up to trendline resistance in the summer and then it declined in nine of twelve weeks. It rebounded for two weeks but quickly reversed at the 10-week moving average which is sloping down sharply. Also, the net speculative position in Gold as of a week ago was 25% of open interest. There are a fair amount of longs left to capitulate. Gold’s downside support targets are $1080, $1040 and $1000.

We’ve been warning for several weeks of the near-term downside potential in precious metals. It is being realized but that does not mean its over. The miners plunged to new lows in recent days yet they are likely to move lower before a major turn. Our work above suggests a minimum of 9% downside potential and as much as 20%. Meanwhile, Gold could fall another 15% to strong support at $1000. Opportunities are coming but they are not here yet. We want to see Gold and gold stocks decline further so that they become extremely oversold as they reach major support levels. That is the combination that could produce a lifetime buying opportunity in the weeks or months ahead.
