Get 40% Off
👀 👁 🧿 All eyes on Biogen, up +4,56% after posting earnings. Our AI picked it in March 2024.
Which stocks will surge next?
Unlock AI-picked Stocks

Monthly And Yearly Decay Rates For Long Volatility Funds

Published 06/23/2016, 03:23 AM
Updated 07/09/2023, 06:31 AM

While it’s certain that short-term volatility exchange traded products (ETPs) like iPath S&P 500 VIX Short-Term Futures Exp 30 Jan 2019 (NYSE:VXX), VelocityShares Daily 2x VIX Short Term linked to SP 500 VIX Short Fut Exp 4 Dec 2030 (NASDAQ:TVIX), and ProShares Ultra VIX Short-Term Futures (NYSE:UVXY) are doomed to march towards zero, their decay rates are not consistent. Things like bear markets and big corrections can cause big upward swings. On the downside, the term structure of VIX futures and the volatility of volatility can significantly impact decay rates in monthly and yearly time frames.

The charts below give a graphical history of their decay rates. With each of them I’m making trade-offs between reducing noise (averaging out normal market action) and the ability to see medium term trends. Each data point on the first chart is computed using the cumulative gain or loss over the previous two years and a monthly compounding period.
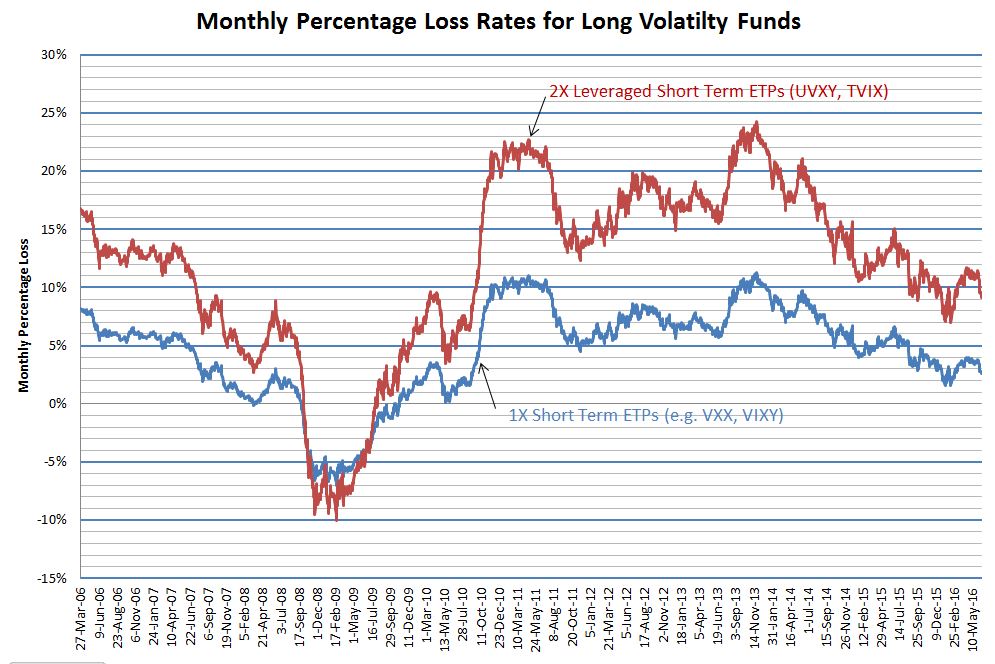
Monthly Percentage Loss Rates For Long Volatility Fund

None of these ETPs existed before 2009 (the first one, VXX started in January 2009), so I used my simulations based on historical VIX futures data to generate the pre-inception data.

The yearly percentage chart below uses a monthly moving average for all the price points and then uses the result for each date and the price a year prior to compute the simple percentage increase or decrease.
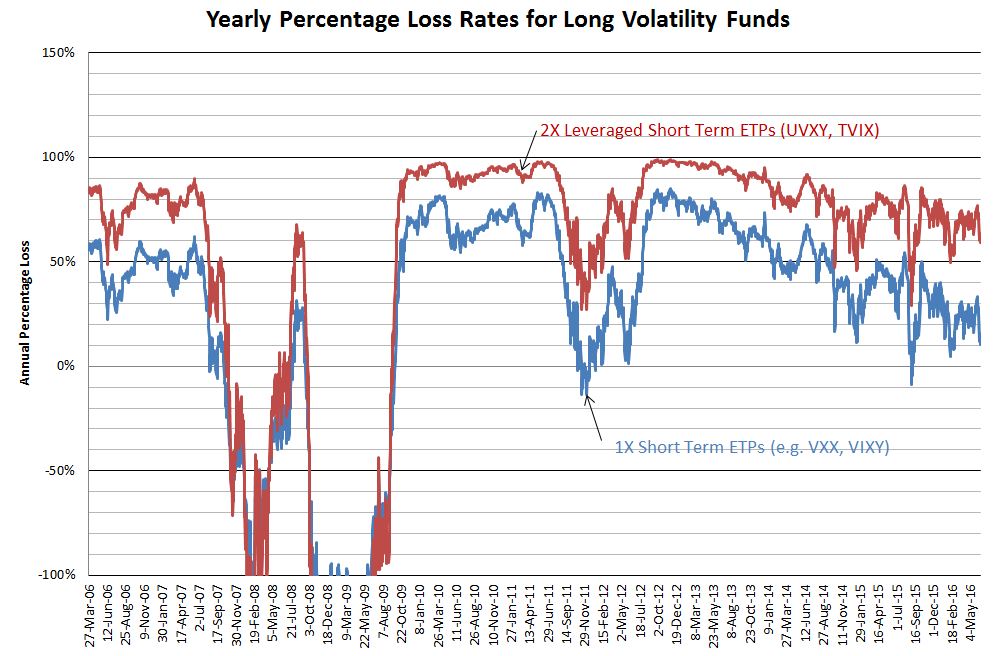
Yearly Percentage Loss Rates For Long Volatility Funds

Despite eye-watering decay rates these funds are increasing in popularity. I’m not sure why (except for the possibility of shorting them).

They are one of the few investments that will reliably go up when the market has a significant drop, but unless your timing is exquisite the decay rates on these ETPs will make you wish you never laid eyes on them.

3rd party Ad. Not an offer or recommendation by Investing.com. See disclosure here or remove ads .

Quant Corner

  1. The formula used in the first chart is the classic compounding equation: Compounded Growth = ((End Price/ Start Price)^(1/Period))-1 To obtain monthly compounded returns over a two year period I used a period of 24, and a start price two years previous to the end price. I negated the results so that decay rates show up as positive numbers.
  2. The second chart uses moving average prices (22 trading days) and computes the percentage using End Price / Start Price -1, with the start price one year previous to the end price. I negated the results so that decay rates show up as positive numbers.

Latest comments

Risk Disclosure: Trading in financial instruments and/or cryptocurrencies involves high risks including the risk of losing some, or all, of your investment amount, and may not be suitable for all investors. Prices of cryptocurrencies are extremely volatile and may be affected by external factors such as financial, regulatory or political events. Trading on margin increases the financial risks.
Before deciding to trade in financial instrument or cryptocurrencies you should be fully informed of the risks and costs associated with trading the financial markets, carefully consider your investment objectives, level of experience, and risk appetite, and seek professional advice where needed.
Fusion Media would like to remind you that the data contained in this website is not necessarily real-time nor accurate. The data and prices on the website are not necessarily provided by any market or exchange, but may be provided by market makers, and so prices may not be accurate and may differ from the actual price at any given market, meaning prices are indicative and not appropriate for trading purposes. Fusion Media and any provider of the data contained in this website will not accept liability for any loss or damage as a result of your trading, or your reliance on the information contained within this website.
It is prohibited to use, store, reproduce, display, modify, transmit or distribute the data contained in this website without the explicit prior written permission of Fusion Media and/or the data provider. All intellectual property rights are reserved by the providers and/or the exchange providing the data contained in this website.
Fusion Media may be compensated by the advertisers that appear on the website, based on your interaction with the advertisements or advertisers.
© 2007-2024 - Fusion Media Limited. All Rights Reserved.