I actually like it when we get past June 20. Knowing that each day has less sun is like a gift to me. I can’t say why. It just feels like a sense of relief.
Let’s look at some ETFs together. It would make a better narrative for me to order these differently, but I’m going to be lazy and leave them alphabetical.
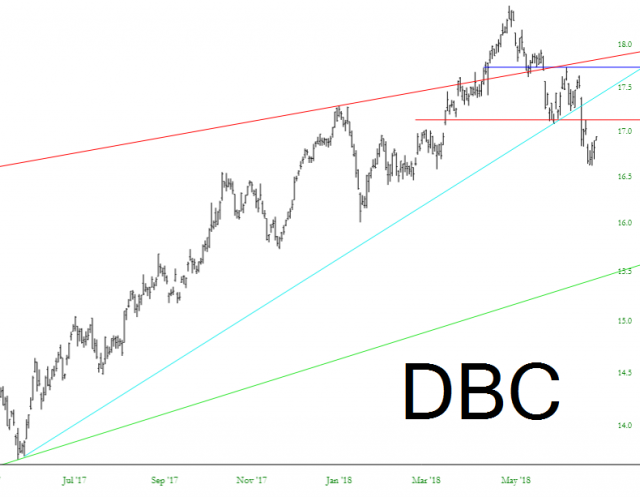
First is commodities, which I think will roll over beneath the red horizontal I’ve drawn. Crude oil, in particular, I believe will drag this lower.
PowerShares DB Commodity Tracking (NYSE:DBC)
The diamonds remain in a long-term and intermediate-term uptrend. Short-term, it’s starting to gently turn lower, but as you can see from the moving averages, it’s going to take a LOT of damage to break this bull run.
SPDR Dow Jones Industrial Average (NYSE:DIA)
Real estate, one of my favorite sectors to short, moved explosively for months, which wrenched the EMAs into positive crossovers. I’m not a believer, though. We bounced off the apex of that broken triangle, and that, I think, is the key.
Direxion Daily Real Estate Bull 3X Shares (NYSE:DRN)
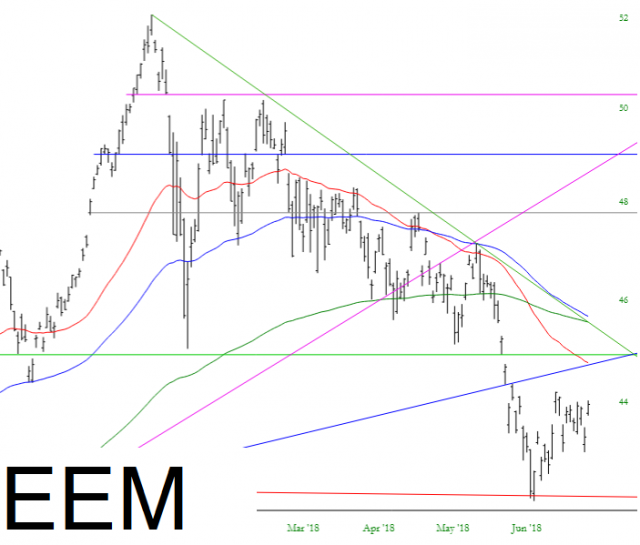
Emerging markets, too, are a hot mess. The overhead supply where that right triangle is drawn is massive, and I don’t think prices are getting back into that zone.
iShares MSCI Emerging Markets (NYSE:EEM)
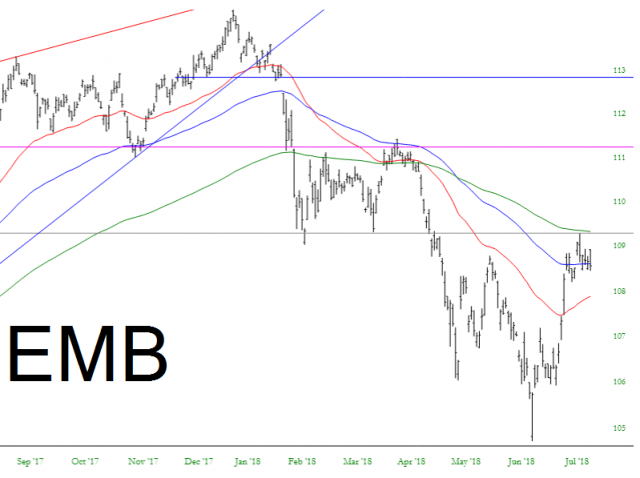
This is echoed, too, in the emerging markets bond fund, which I continue to see as one of the best short opportunities of 2018.
iShares JPMorgan (NYSE:JPM) USD Emerging Markets Bond (NASDAQ:EMB)
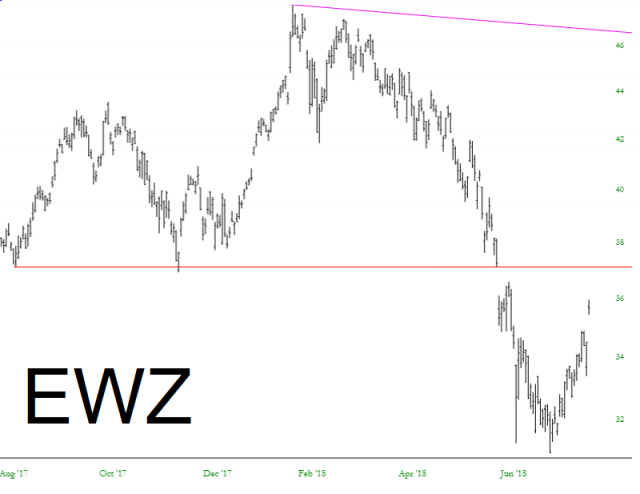
Brazil, too, exploded higher after being pummelled for months on end. Once more, the red horizontal (anchored to a gap) is the limit to this up-move, I believe.
iShares MSCI Brazil Capped (NYSE:EWZ)
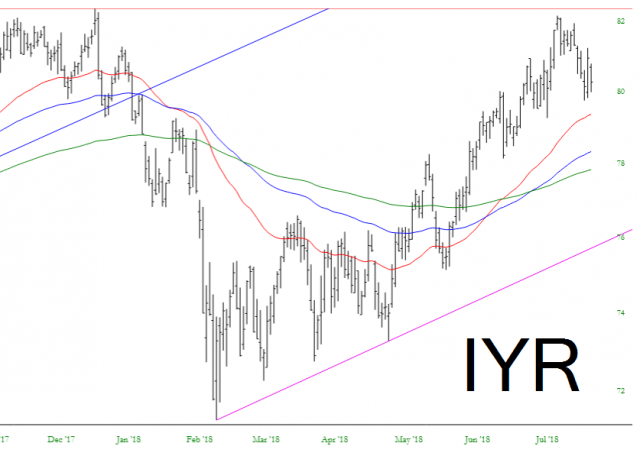
As another look at real estate, here is the non-leveraged instrument iShares US Real Estate (NYSE:IYR), which, similar to DRN, defeated its moving average downturn but I also think is exhausted with its countertrend battle.
The S&P 100 ETF got terrifically close to its gap, but it turned away. Unless it penetrates that horizontal, equities continue to be at short-term risk.
iShares S&P 100 (NYSE:OEF)
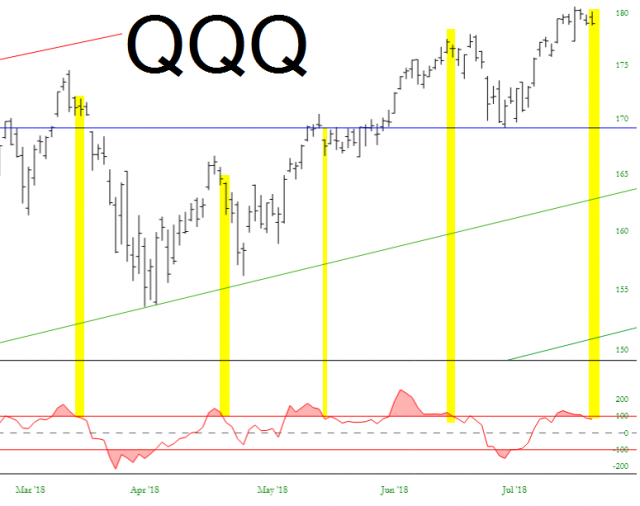
Another glimmer of hope for the pathetic, battered, bloodied bears is expressed in the tech-heavy NASDAQ, shown below with its CCI. This week is obviously key, as Intel (INTC), Amazon (AMZN), and Facebook (FB) all reported. This week is going to be a whopper.
PowerShares QQQ Trust Series 1 (NASDAQ:QQQ)
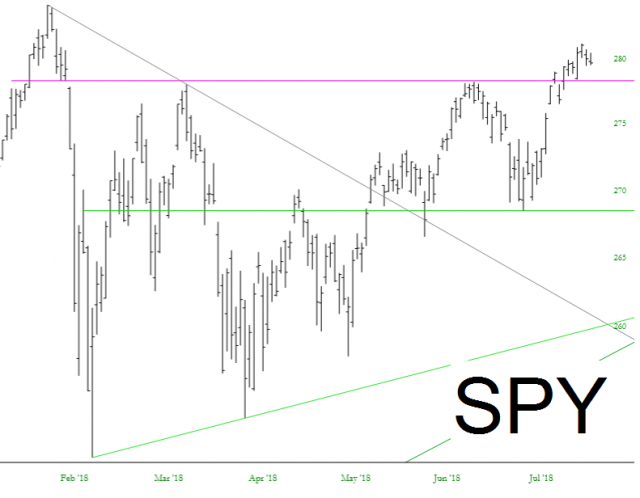
The S&P 500, unless the 100, has already bested its gap and made it over its horizontal. It needs to stay above the horizontal to maintain this bullish breakout.
SPDR S&P 500 (NYSE:SPY)
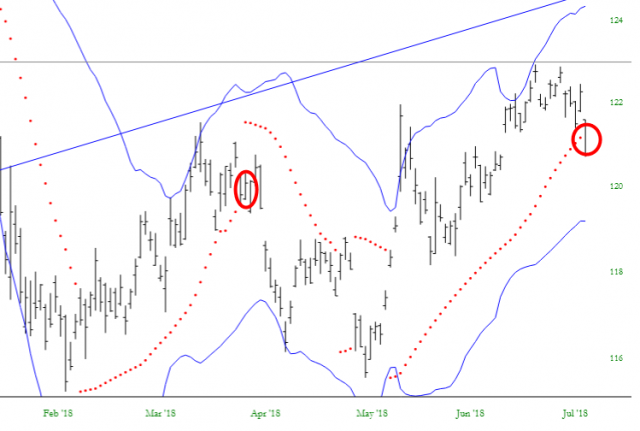
Bonds have finally broken their PSAR. As shown the last time this happened, this could be a good reversal signal.
Lastly, the financials looms large as perhaps the most important sector of all. I won’t bore you with the long-term analog again. Let’s just say within two weeks we should have a much clearer picture as to what the rest of the year holds for this sector.
Financial Select Sector SPDR (NYSE:XLF)

