Last week saw markets top out, for now, at resistance levels and it wasn’t rocket science to predict after such a strong previous two weeks.
That said, there are some stocks who are holding up so I did do some buying and it ended up being a solid week for myself and subscribers.
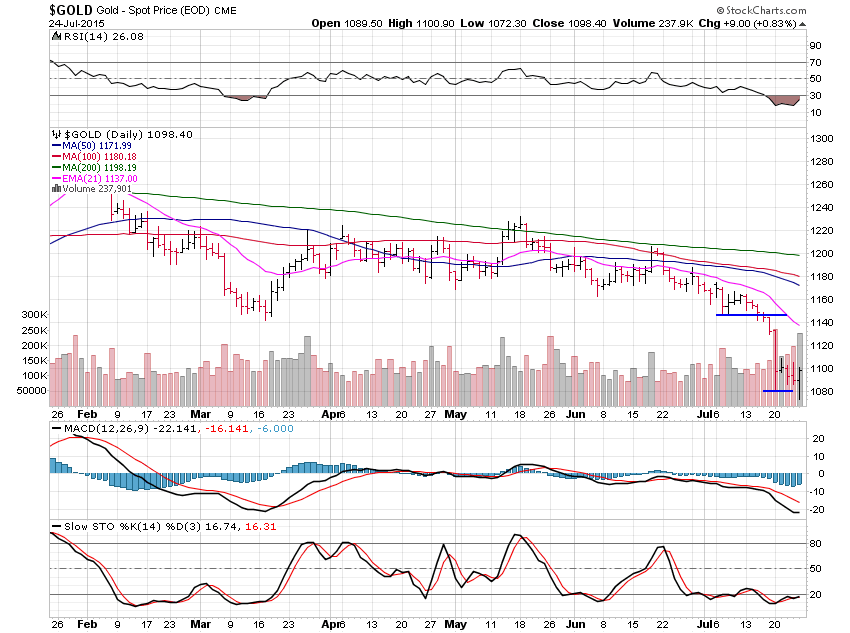
Gold on the other hand continued to waterfall lower until Friday and we now look set to see shorts cover and we should see a range trade chop around for up to a couple of months.
The ultimate low in gold does not look to be in yet but we likely won’t move to the ultimate low around $1,000 until later summer or early fall.

Gold lost 2.99% this past week in a strong move lower on heavy volume and Friday began the short-covering move.
We should build a base between $1,080 snd $1,140 to $1,145 for a couple of months before we see the next big break lower which is likely to be where we can look for a major low to be put in and a trend change to finally begin.
The major trend remains lower, quite obviously, and my hate mail indicator remains at zero.

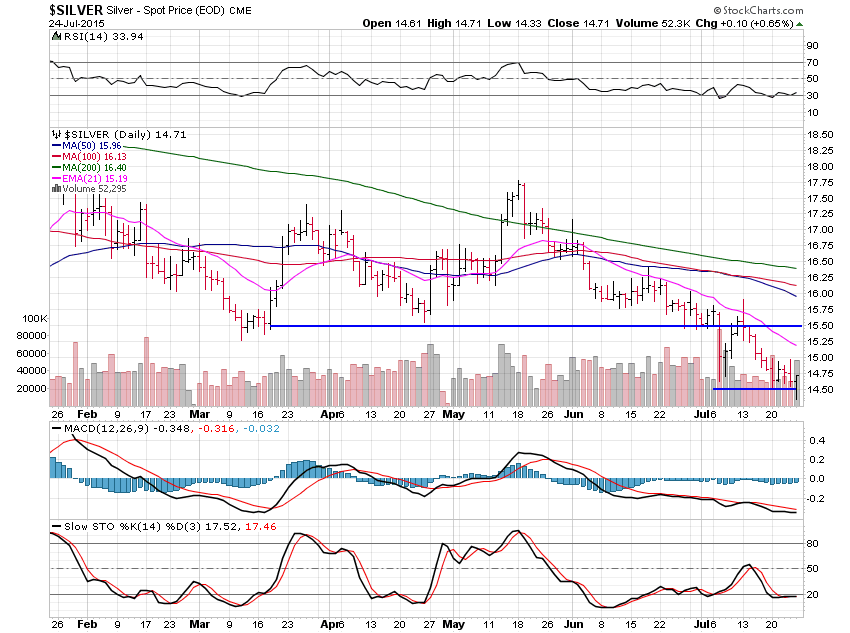
Silver lost only 0.68% this past week but was close to losing much more.
It looks like silver has a wide range to trade in now between $14.50 and $15.50 and $15 is also a pivot point to watch for support and resistance areas to build.

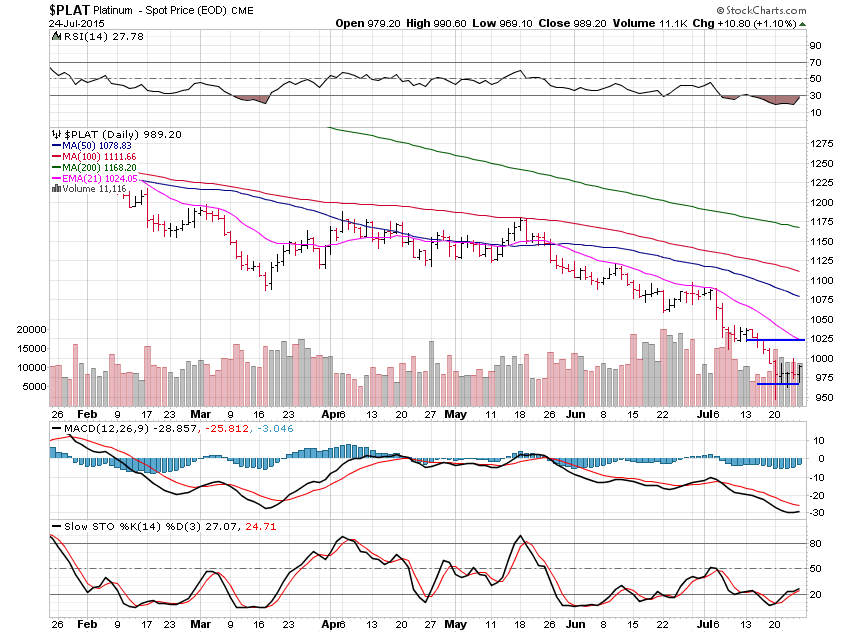
Platinum fell 0.41% this past week and still just follows gold and silver around.
I’d look for a range between $1,025 and the $970 area as long as gold and silver are trading in a range and the next major support level is $800.
There really isn’t a lot to say as the metals are finding lows and set up to range trade for a while but we will have some great moves lower once again and those should be quite easy to trade and quite spectacular, with a likely strong overshoot on the low-side to suck in the many perma-bulls who will finally give up and throw in the towel in a fit of rage, selling and despair only to see the metals turn up and change the dominant trend.
It’s always the same for those who won’t learn this great game of trading. The fools, don’t be a fool.
Learn to trade and get your finger on the pulse of the market by subscribing to my nightly newsletter, or at least reading my free nightly blog at www.wizzentrading.com

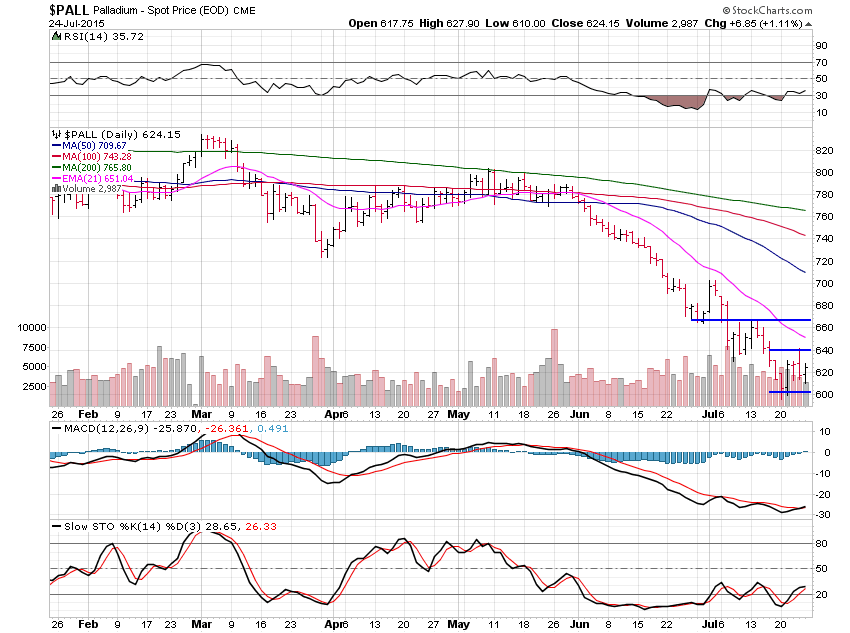
Palladium slid 1.70% this past week and is also set to see a range trade now.
Looks like $600 to the $665 area should be the range with $640 an area to watch for pivots.
A nice easy and short letter for you this weekend with the next couple of months action looking to be set already for the metals so enjoy the summer unless the ranges I talked about are broken and then things may get serious quickly.