PMI Day: Week Of The Central Banks
The dollar is starting the day higher against most other currencies as the market focused on the prospects for an improving US economy. Friday’s data showed that personal income rose less than expected and personal spending dropped unexpectedly in July, but the market preferred to focus on the jump in the Chicago PMI and the surge in consumer confidence, which reinforced the bull case for the dollar. The rising tensions in Ukraine are also helping the US currency, as the likely impact of further sanctions on the Eurozone economy can no longer be ignored. As a result, it is opening higher than its early Frida levels against all the G10 currencies except NZD. Among the EM currencies, the dollar was little changed on average. It gained against the Eastern European currencies, particularly RUB, as the Ukrainian situation worsened, but fell vs BRL.
Overnight news: NZD rallied after its official terms of trade index rose 0.3% qoq in 2Q, contrary to expectations of a 3.5% drop. This belies the impression from ever-decreasing prices at the biweekly milk auctions. With Australia’s terms of trade weakening, the difference should depress AUD/NZD.
Japan’s corporate data showed that company sales and profits and capital spending plans slowed sharply in Q2, but this was dismissed as an aberration caused by the hike in the sales tax. JPY weakened against the rising dollar (although JPY strengthened a bit vs EUR) and stocks rose regardless.
China’s official manufacturing PMI for August was pretty much in line with expectations at 51.1, down from 51.7, while the HSBC/Markit final PMI for China was revised down to 50.2 from the initial 50.3. Both showed a slowing economy but at least they remained above the critical 50 barrier.
Today’s indicators: It’s a PMI day in Europe as well. It starts with the manufacturing PMI figures for August from several European countries, the Eurozone as a whole and the UK. As usual, the final forecasts for the French, the German and Eurozone’s figures are the same as the initial estimates. The UK manufacturing PMI is estimated to be slightly down to 55.1 from 55.4.
The UK manufacturing PMI is estimated to be slightly down. UK mortgage approvals for July are also coming out. Last month mortgage approvals rose after four consecutive declines, but they are expected to resume their decline this month. The combination of a lower PMI and lower mortgage acceptances could put downward pressure on the pound.
US and Canadian markets are closed for the Labor Day holidays.
As for the rest of the week, six of the G10 Central Banks hold their meetings. The spotlight will be on ECB policy meeting on Thursday, especially after the recent poor economic data from Euro area along with President Draghi’s comments on inflation expectations at Jackson Hole event. Given that the Bank has hired an outside advisor to advise on a possible ABS program, I expect further clarifications about the likelihood of ABS purchases – a form of “private sector QE” – at the press conference following the decision. On Tuesday, the Reserve Bank of Australia meets. Economists unanimously expect the RBA to keep rates steady, and I anticipate no significant changes in the statement accompanying the rate decision. On Wednesday, it’s the Bank of Canada’s turn. At their last meeting, the BoC kept a neutral stance and revised their GDP growth forecast down for 2014 and 2015. I expect them to repeat themselves and remain on hold. On Thursday, besides ECB, BoJ, Riksbank and BoE hold their policy meetings. Following Riksbank’s unexpected 50bps rate cut in early July and given that the country’s economics haven’t improved, we might see additional action from the Nordic central bank. The BoE is unlikely to change policy and therefore the impact on the market as usual should be minimal. The minutes of the meeting however should make interesting reading when they are released on 17th of September, especially after the two dissenting votes at last month’s meeting. The slowdown in Japan’s inflation could eventually trigger more action by the BoJ, and the statement from the policy meeting should give us more insights into n their next action.
On Tuesday, the Reserve Bank of Australia meets. Economists unanimously expect it to keep rates steady. Since the RBA last met on Aug. 5th, the Aussie is almost unchanged vs the USD. There are probably more worries about the Chinese economy, which has continued to weaken, and Australian unemployment has risen to a 12-month high, but capital spending, the biggest worry for the Australian economy recently, has managed to keep growing. As a result, I anticipate no significant changes in the statement accompanying the rate decision.
Finally on Friday, the major event will be the US non-farm payrolls for August. The market consensus is for a rise of 209k, down from 220k in July. At the same time the US unemployment rate is forecast to have declined to 6.1% from 6.2%. The seventh consecutive figure above 200k would show continued strong growth in jobs, bolstering the FOMC’s confidence and the dollar.
Eurozone’s preliminary Q2 GDP and Canada’s unemployment rate for August are also released Friday.
The Market
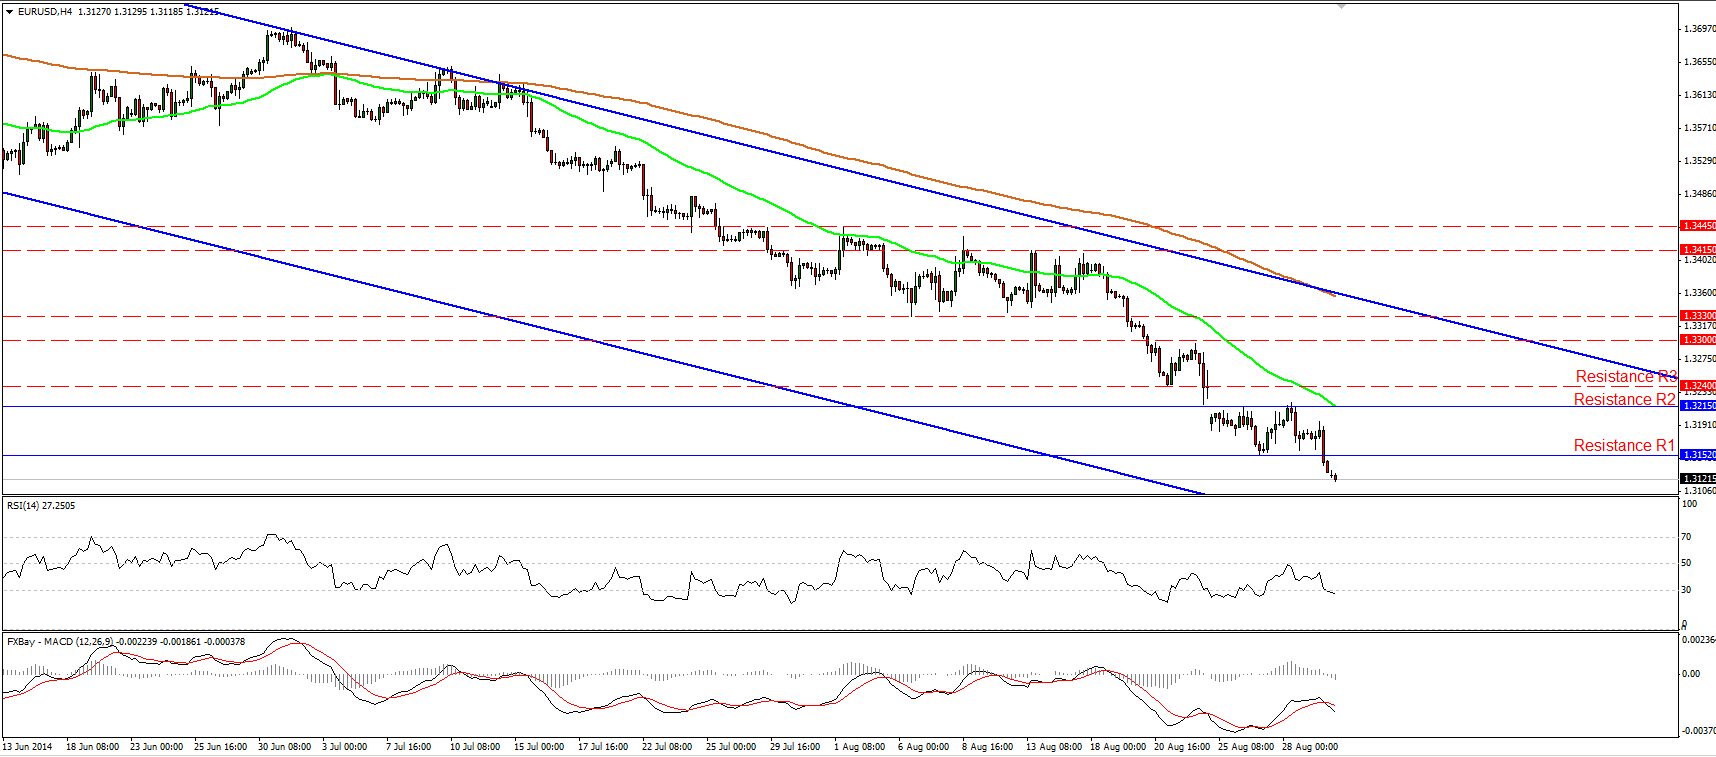
EUR/USD breaks below 1.3152
EUR/USD fell below 1.3152 (support turned into resistance), the lower boundary of the range it’s been trading in since the 25th of August. I would now expect the rate to find support at 1.3100 (S1), the lows of the 6th of September 2013, or near the lower boundary of the blue downside channel, connecting the lows and the highs on the daily chart. Although the overall picture remains to the downside, I will take the sidelines as soon as the rate reaches the aforementioned support area. The possibility of a corrective bound near the lower bound of the channel remains high, so I will wait for the market reaction once the price is near that zone. If the bears ignore these support lines and continue pushing the rate lower, we are likely to see extensions towards the psychological zone of 1.3000 (S2).
• Support: 1.3100 (S1), 1.3000 (S2), 1.2900 (S3).
• Resistance: 1.3152 (R1), 1.3215 (R2), 1.3240 (R3).
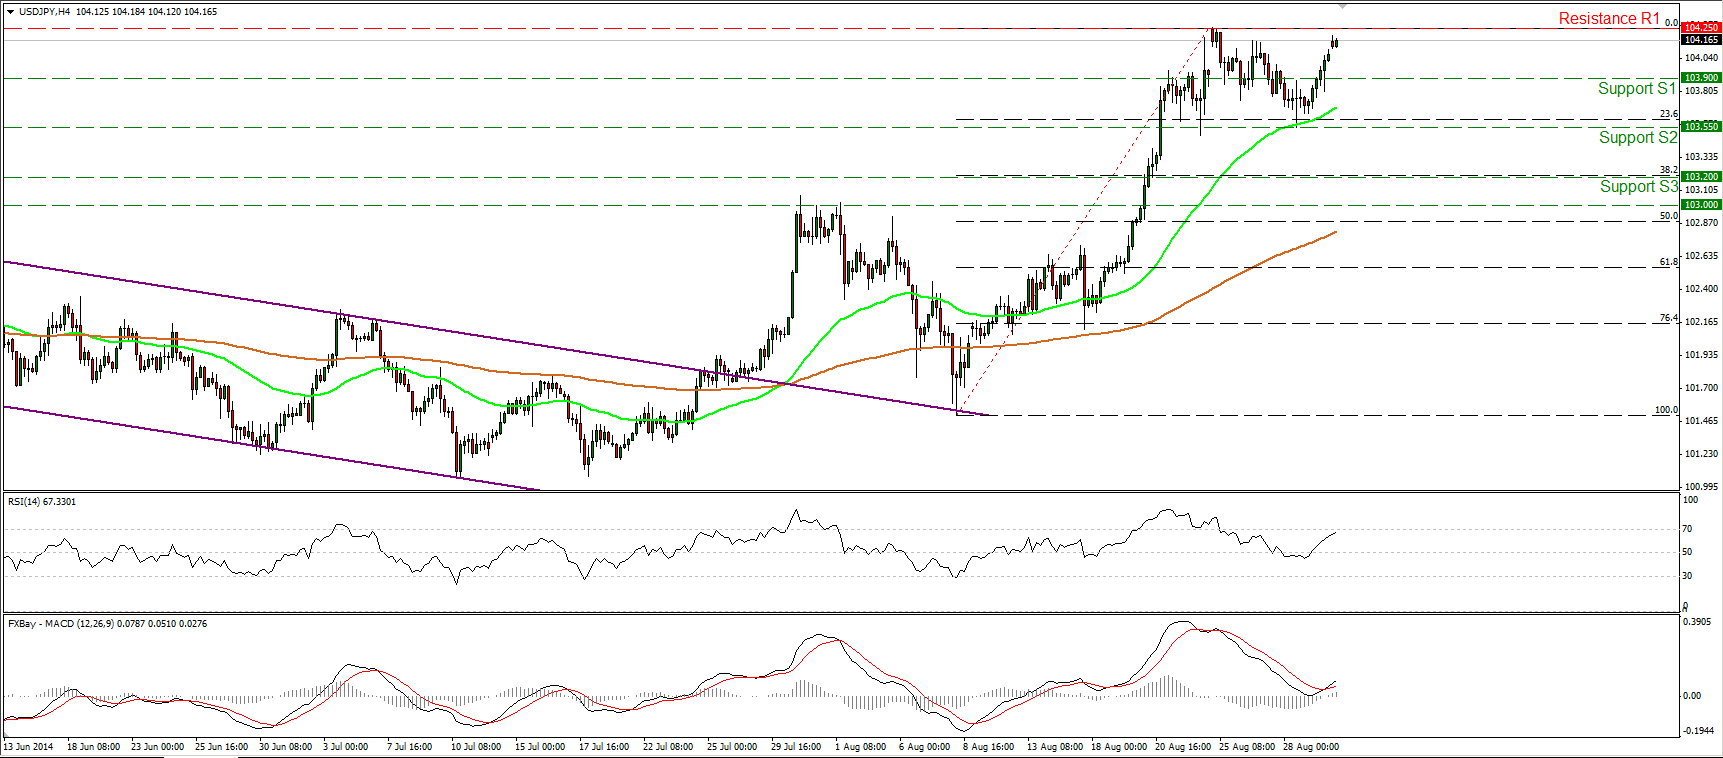
Is USD/JPY resuming its long-term uptrend?
USD/JPY climbed above 104.00 again, after finding strong support at the 103.55 (S2) barrier, near the 23.6% retracement level of the 8th – 25th August upside wave. Today, during the early European morning, the rate is trading slightly below the recent highs of 104.25 (R1). I still believe that a clear move above that line could set the stage for extensions towards our next resistance hurdle, at 104.85 (R2), defined by the high of the 23rd of January. In the bigger picture, I still see a newborn long-term uptrend, since the price structure remains higher highs and higher lows above both the 50- and the 200-day moving averages.
• Support: 103.90 (S1), 103.55 (S2), 103.20 (S3).
• Resistance: 104.25 (R1), 104.85 (R2), 105.00 (R3).
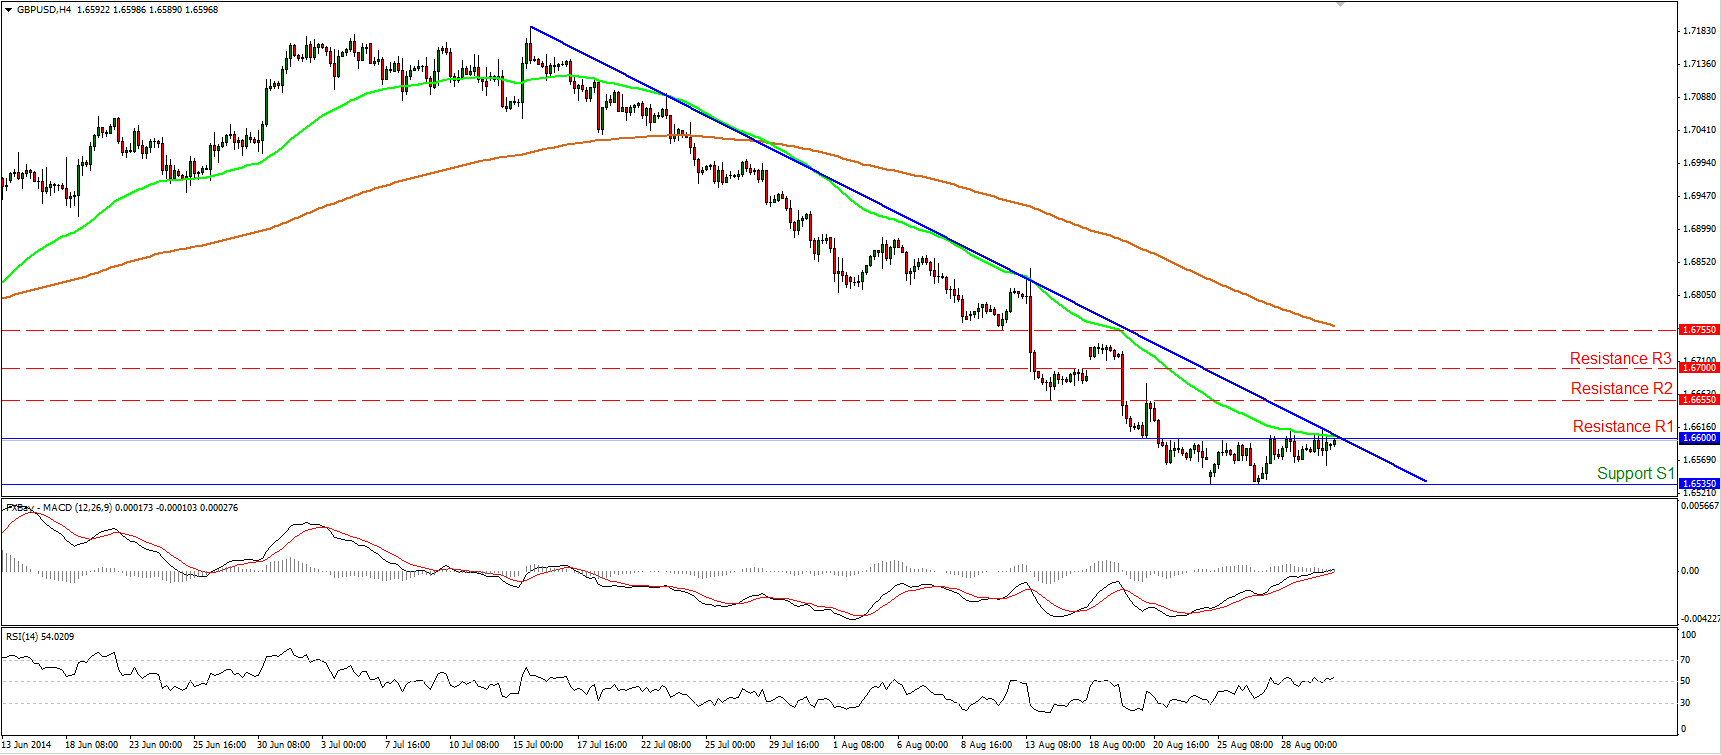
GBP/USD testing the downtrend line
GBP/USD continued ranging between the support line of 1.6535 (S1) and the resistance of 1.6600 (R1). At the time of writing, the rate is ready to challenge the point of intersection between the 1.6600 (R1) line and the downtrend line drawn from the highs of the 15th of July. A clear move above 1.6600 is likely to signal the beginning of a corrective phase and could challenge our next resistance obstacle at 1.6655 (R2), first. On the other hand, we need to see a dip below 1.6535 (S1) to have a forthcoming lower low and the continuation of the downtrend. In the bigger picture, Cable remains below the 80-day exponential moving average, the moving average that supported the lows of the price action for a whole year. As a result, the overall outlook remains negative in my view, and I would see any possible bullish moves as corrective waves.
• Support: 1.6535 (S1), 1.6460 (S2), 1.6350 (S3).
• Resistance: 1.6600 (R1), 1.6655 (R2), 1.6700 (R3).
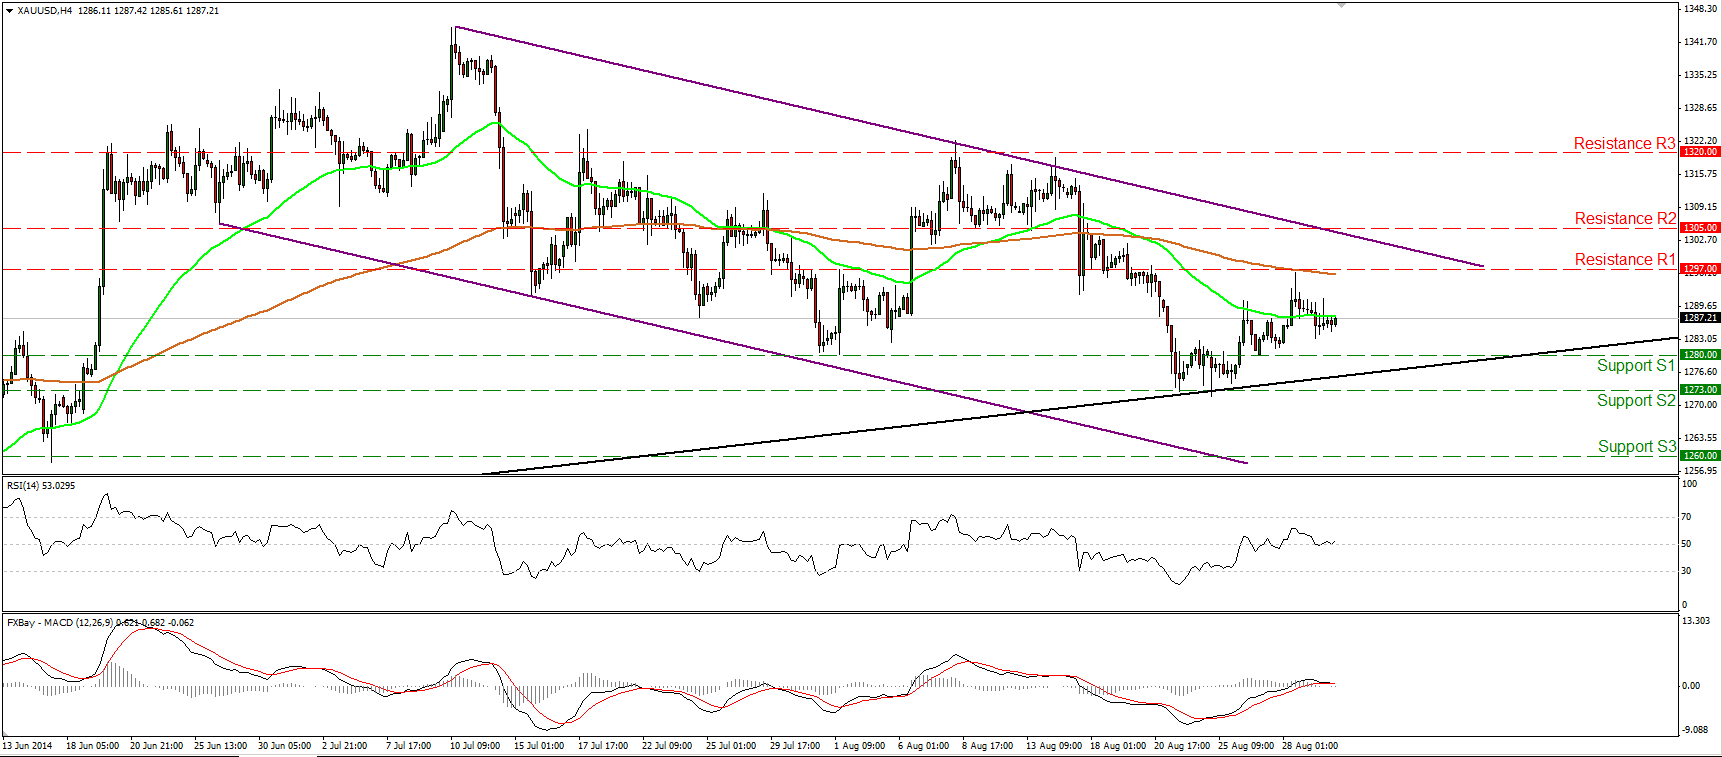
Gold in a consolidative move
Gold moved sideways on Friday, remaining between the support line of 1280 (S1) and the resistance of 1297 (R1). Both the RSI and the MACD lie near their neutral lines, confirming investors’ reluctance to choose a direction. The possibility for a higher low still exists though and as a result I consider the near term picture to be cautiously to the upside. However, the yellow metal is still trading within the purple downside channel, connecting the lows and the highs on the daily chart, thus I would see any possible upside waves as a corrective move, at least for now.
• Support: 1280 (S1), 1273 (S2), 1260 (S3).
• Resistance: 1297 (R1), 1305 (R2), 1320 (R3).
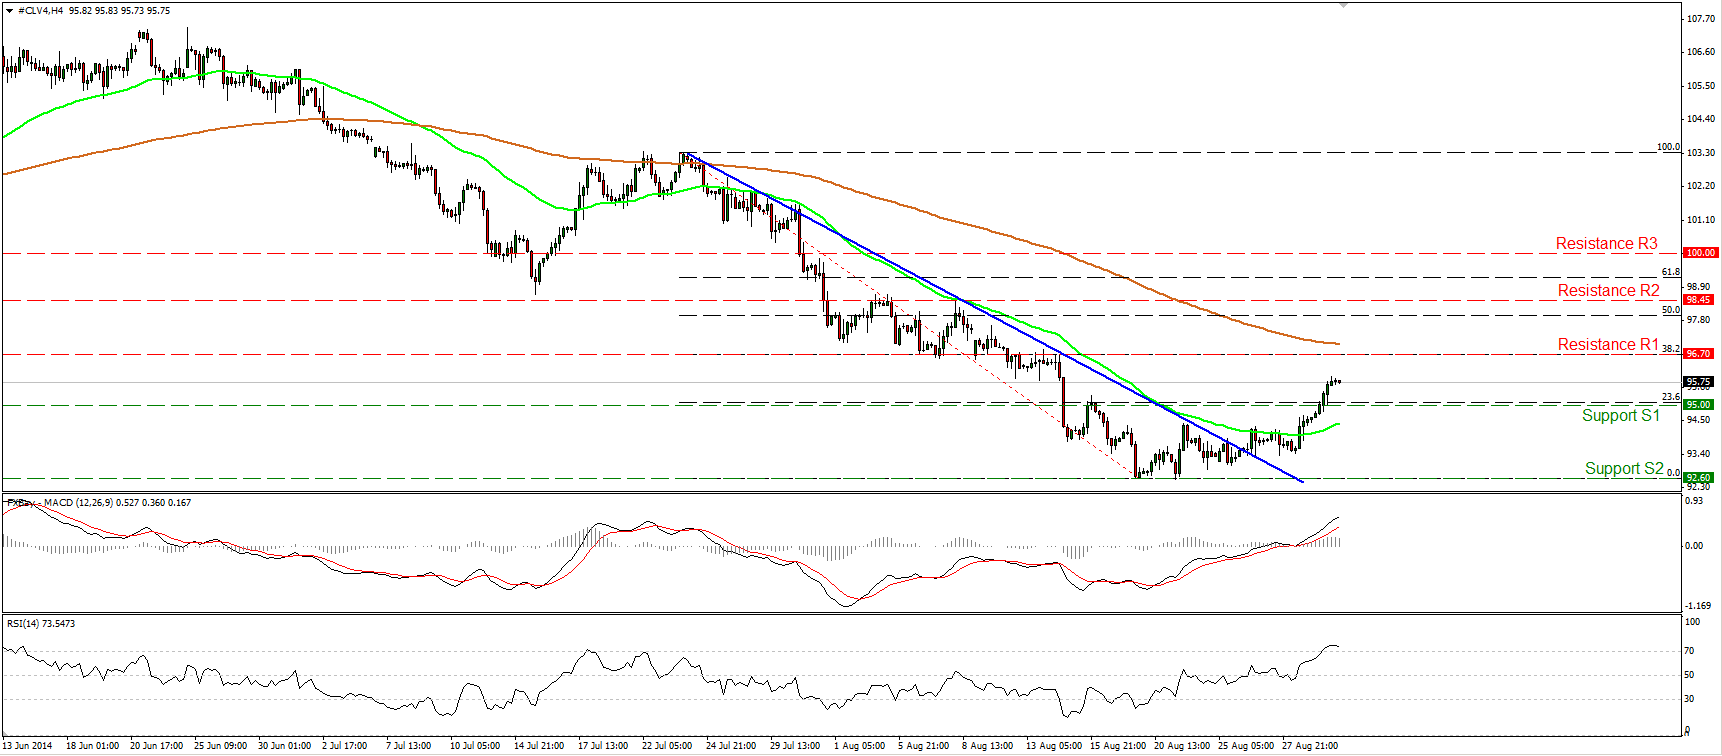
WTI breaks above 95.00
WTI continued moving higher on Friday, violating the psychological barrier of 95.00 (resistance turned into support), which lies near the 23.6% retracement level of the 23rd July – 19th August downtrend. I will stick to the view that such a break is likely to target our next resistance, at 96.70 (R1), which coincides with the 38.2% retracement level of the aforementioned down move. The MACD lies above both its zero and signal lines, confirming the recent strong positive momentum, but the RSI lies within its overbought zone, pointing down. Bearing our momentum signs in mind, I would be cautious of a pullback before the longs take control again, perhaps to challenge the 95.00 (S1) zone as a support this time. On the daily chart, the 14-day RSI moved higher, and is now slightly below its 50 line, while the daily MACD, although negative, lies above its trigger. This corroborates my view that we are likely to see further bullish moves, at least towards our first resistance, at 96.70 (R1).
• Support: 95.00 (S1), 92.60 (S2), 91.60 (S3).
• Resistance: 96.70 (R1), 98.45 (R2), 100.00 (R3).

