
EUR/USD
The euro lost ground on yesterday’s acceleration off daily high at 1.3750 zone and broke below strong 1.3700/1.3585 support zone. The fall found temporary support at 1.3660, Fibonacci 38.2% retracement of 1.3482/1.3772 upleg / daily 55SMA, with subsequent recovery bounce so far being contained under 1.37, now reverted to resistance. Negative tone established on lower timeframes keeps the downside at risk, as current rally is seen corrective and preceding fresh leg lower. Loss of 1.3660 handle open immediate support at 1.3650, daily Tenkan-sen line / 20SMA, ahead of 1.3620, daily 100SMA and psychological 1.3600 support, also Fibonacci 61.8% retracement. On the upside, previous consolidation floor, along with 4-hour 10/55SMA’s bear cross and Fibonacci 38.2% of 1.3756/1.3660 fall, offers good resistance, while only extension above 1.3720, Fibonacci 61.8% retracement, would sideline immediate bears.
Resistance: 1.3700; 1.3720; 1.3755; 1.3772
Support: 1.3660; 1.3620; 1.3600; 1.3584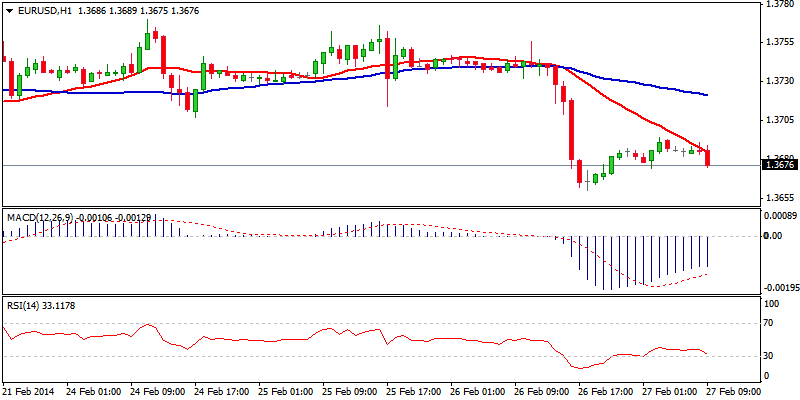 EUR/USD Hour Chart" title="EUR/USD Hour Chart" width="800" height="400">
EUR/JPY
Near-term tone remains weak, as fresh acceleration lower extended pullback from 141.25 and broke below trendline support at 140.25 and psychological 140.00 support, also Fibonacci 61.8% retracement of 139.18/141.25 upleg. Bears found footstep at 136.64, with subsequent bounce consolidating around 140 handle, after stalling at 140.25, Fibonacci 38.2% of 141.25/139.64 descend. Near-term studies turned negative and keep the downside at risk. Fresh bears to focus 139.18, 20 Feb spike low and 139.00, round figure support and 138.90 higher platform. Extension above recovery peak would ease bear pressure, however, only regain of yesterday’s high and lower top at 140.77, would neutralize near-term bears.
Resistance: 140.25; 140.44; 140.63; 140.77
Support: 139.85; 139.64; 139.18; 139.00 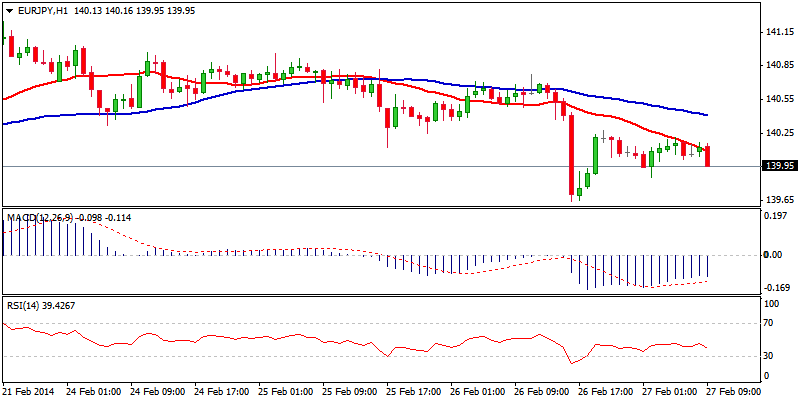 EUR/JPY Hour Chart" title="EUR/JPY Hour Chart" width="800" height="400">
GBP/USD
Cable remains in near-term sideways mode, with price action being established within 1.6620 and 1.6725 range. Lack of momentum to sustain gains above 1.67 barrier, triggered pullback to 1.6620, keeping strong 1.66 support intact for now. Neutral tone prevails on near-term studies and sees fresh direction on a break through either of range limits, while larger picture bulls remain in play and see the upside favored, once corrective phase off 1.6821 peak is completed. Ideally, 1.66 handle should keep the downside protected, otherwise broader bulls may be delayed in case the price clearly breaks below 1.66 support.
Resistance: 1.6700; 1.6725; 1.6740; 1.6800
Support: 1.6656; 1.6619; 1.6600; 1.6582 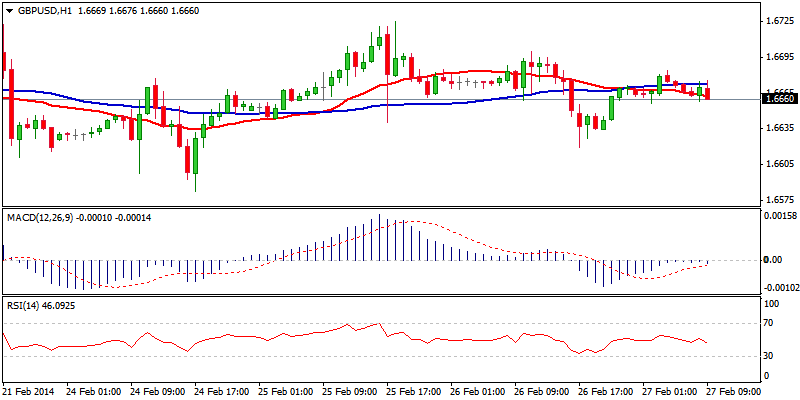 GBP/USD Hour Chart" title="GBP/USD Hour Chart" width="800" height="400">
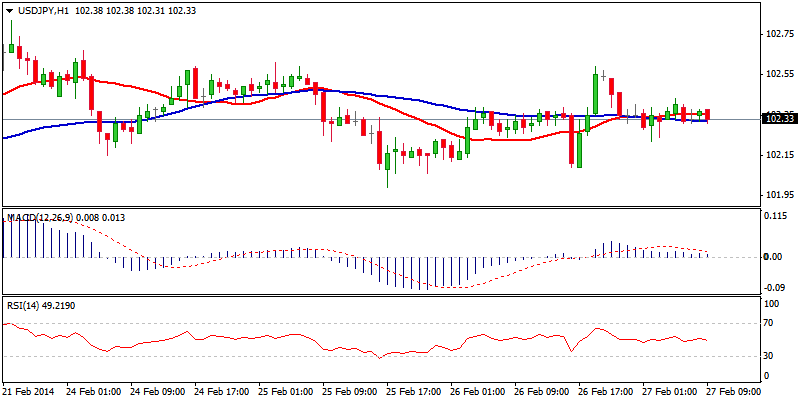
USD/JPY
Near-term price action enters neutral mode, with price moving within 102.00 and 102.60 range. Psychological 102 support is reinforced by bull-trendline, drawn off 100.79 low and Fibonacci 38.2% retracement of 100.79/102.82 upleg, with break here seen increasing downside risk. On the upside, immediate barriers lay at 102.60, ahead of near-term congestion tops at 102.70, reinforced by daily Kijun-sen line, above which to signal resumption of recovery rally from 100.74, 04 Feb low.
Resistance: 102.59; 102.82; 103.09; 103.43
Support: 102.22; 102.00; 101.57; 101.37
 USD/JPY Hour Chart" title="USD/JPY Hour Chart" width="800" height="400">
AUD/USD
The pair came under pressure after the price broke below one–week range floor at 0.8930 zone and Fibonacci 38.2% retracement of 0.8658/0.9079 ascend, attempting at psychological 0.8900 support, also daily Ichimoku cloud base. Hourly studies are negative and reached oversold zone, while 4-hour indicators broke below their midlines that suggests further downside. Consolidation around 0.89 handle would likely precede fresh leg lower, which is going to test Fibonacci supports of 50% and 61.8% retracement at 0.8869 and 0.8819 respectively, with the latter also marking previous 28/30 Jan consolidation top. Lower tops at 0.8944 and 0.8967 offer initial resistances, while stronger recovery rallies should be ideally capped under psychological 0.9000 resistance, near 61.8% retracement of 0.9048/0.8902 descend.
Resistance: 0.8944; 0.8967; 0.9000; 0.9024
Support: 0.8900; 0.8869; 0.8819; 0.8800 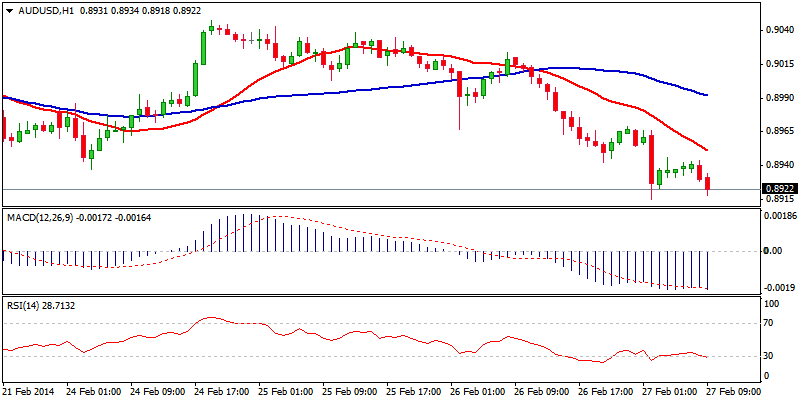 AUD/USD Hour Chart" title="AUD/USD Hour Chart" width="800" height="400">
AUD/NZD
The pair is under increased pressure, as loss of 1.08 handle accelerated losses below 1.0731, 13 Feb near-term range floor and probes below psychological 1.0700 support, also daily cloud base and near mid-point of entire 1.0488/1.0942 rally. Near-term studies maintain firm bearish tone and favor clear break below 1.0700 handle, towards 1.0661, Fibonacci 61.8% retracement and psychological 1.0600 support, near 76.4% retracement, in extension. Overextended hourly conditions, however, may interrupt bears in favor of consolidative/corrective action, with initial barriers at 1.0741 and 1.0767 and 1.0800 barrier expected to cap
Resistance: 1.0731; 1.0741; 1.0767; 1.0800
Support: 1.0661; 1.0640; 1.0600; 1.0557 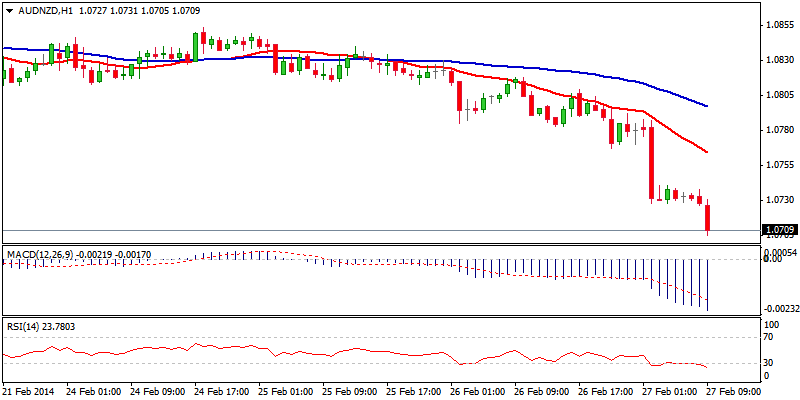 AUD/NZD Hour Chart" title="AUD/NZD Hour Chart" width="800" height="400">
XAU/USD
Spot Gold trades in extended corrective phase off fresh peak at 1345, as pullback penetrated below ideal support and expected reversal point at 1330, Fibonacci 38.2% of 1307/1345 ascend. Near-term bulls are now sidelined, as the price dipped to 1322 so far, Fibonacci 61.8% retracement / 4-hour 55SMA and near-term technicals turned negative. Previous strong support at 1330, capped recovery attempts off fresh low at 1322, along with descending hourly 20SMA. Further downside should be anticipated, with break below 1322 to open next supports at 1318, 24 Feb higher low and minor base at 1315, with strong support and base at 1307 expected to come in focus on violation of 1315. Conversely, holding above 1322, would signal basing attempt, with clear break above initial 1330 barrier, and double bear-cross of 10/55 and 20/55 hourly SMA’s, required to confirm and avert immediate downside risk.
Resistance: 1330; 1334; 1339; 1345
Support: 1322; 1318; 1315; 1307 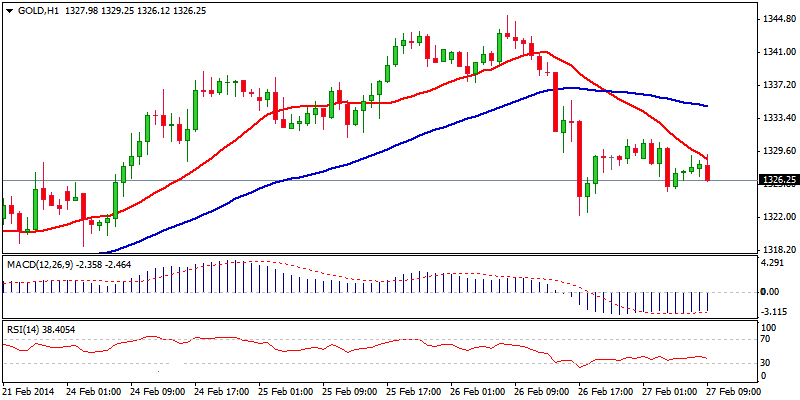 XAU/USD Hour Chart" title="XAU/USD Hour Chart" width="800" height="400">