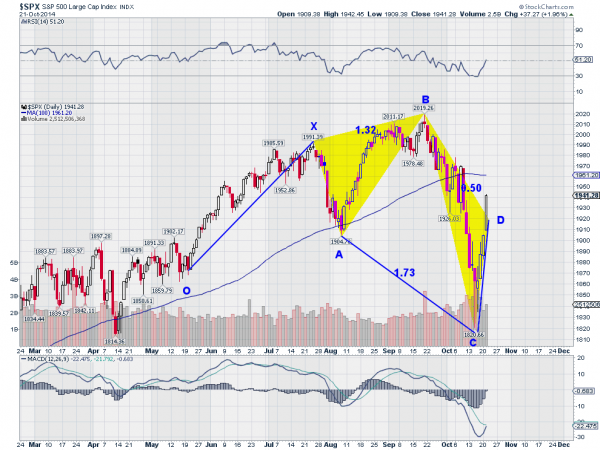
Five and a half years ago the broad equity markets bottomed and started higher. That is a long time in market terms. There have been pullbacks and corrections along the way and when they have happened I have described them as “Pullback in the Uptrend” or “Short Term Caution in the Uptrend”. This has probably labeled me a perma-bull in the eyes of many but that is not really the case.
It is easy to recognize the opposite, a perma-bear, in the environment we have been in. They have unending calls for a reversal or a top despite a continuing train of a market driving higher. Perma-bulls though have been hiding among the trend higher. You will not find them until the market begins a prolonged downtrend and they are still looking for a reversal higher. This is why I do not count myself as a perma-bull. I do not intend to overstay my welcome to the long side in the face of evidence that a downturn is here.

I am not yet ready to call this pullback a downturn, but I am also not ready to declare it over after a 4 day move higher. There are too many mixed messages. You may recall this video from the beginning of September where I was looking for the market to move sideways between 1900 and 2000 for rest of the year before moving up in 2015. If it holds the recent move back higher over 1900, the 6 days spent below that range will look like a meaningless blip on a chart.
The strength of the move lower makes for an interesting dilemma. From a technical perspective the speed lower brought the market to an oversold condition quickly. During that hard run lower I moved to a cautious stance on the S&P 500 and put the uptrend in jeopardy on the S&P 500. The rebound gave some relief but the S&P 500 still has some significant technical levels to clear before you can turn bullish. Caution is still warranted. It did clear the 20 day SMA and the PRZ for the bearish 5-0 harmonic on Tuesday. But is yet to break a 61.8% retracement of the down leg, the RSI is still just at the mid-line and the MACD has not crossed up yet. Also the volume on the move higher has been falling as the long candles have been racing higher, with a gap up Wednesday. This gap up on falling volume could be a sign of exhaustion, and below the 61.8% retracement if gives some caution.
I am not full blown bull after 3 strong up days, and I am sure that surprises many casual observers. But I am not ready to be bearish yet either. A move over 1961 the 100 day SMA will help and over 1985 could solidify an end to the pullback. Under 1900 and I will lean more toward the downside. Until then I am just cautious.
Disclaimer: The information in this blog post represents my own opinions and does not contain a recommendation for any particular security or investment. I or my affiliates may hold positions or other interests in securities mentioned in the Blog, please see my Disclaimer page for my full disclaimer.
