- PBoC holds off on easing, global equities plummet.
- Safe haven flows and equity liquidation dominate.
- Carry trade: massive unwinding continues.
- Will Jackson Hole Summit provide clues?
Capital markets continue to see red as risk aversion flows have switched into a higher gear; worries over a China slowdown, FOMC policy uncertainty and disinflationary macro environment continue to weigh on investor risk sentiment.
With China’s Shanghai Composite plummeting close to -12% last week, dealers were anticipating an aggressive easing response from Chinese officials over the weekend to stem the negative tide by reducing the reserve-requirement ratio (RRR) and freeing up over $100 billion for loans. The recent yuan manipulation by authorities has only managed to squeeze yuan funds out of the domestic market and heightened capital flight concerns.

Instead, regulators announced that China’s national pension fund would be able to invest in the equity market. This move should be considered effective in expanding investor participation and supporting local bourses in the longer term, but offers little in terms of immediate aid to support lending and is the reason the Shanghai Composite has fallen another -8.5% in the overnight session. The index is now trading in negative territory on the year. Despite the disappointment, the market continues to expect Chinese authorities to eventually implement the third comprehensive reduction to the RRR this year, sooner rather than later.
Heightened Risk Aversion Trading
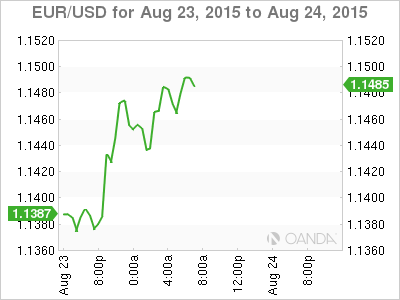
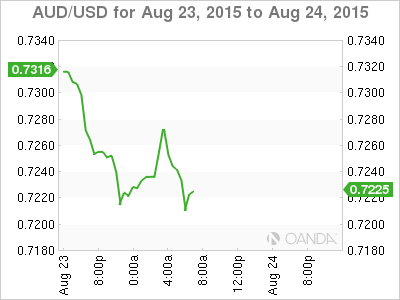
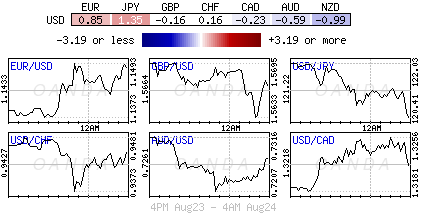
With global risk aversion dominating trading, investors continue to demand U.S Treasuries (10-Year +2.02%), JPY (¥120.55) and EUR (€1.1475) at the expense of the USD, commodities and commodity forex. While emerging currencies have renewed there selling interest, mirroring the equity moves (RUB -2.6%, ZAR -2% and TRY -1%).
In the overnight session, Europe’s single unit has managed to print a seven-month high (€1.1494) as fears of investor deleveraging fuel short covering of the euro. For the past 18-months the euro, similar to the yen, has been used as a conduit for earning higher yields on emerging market assets. But as Asian EM currencies remain under pressure, the gains from higher yielding currencies continue to be eroded, prompting the market to limit their exposure to those positions. Investors are trying to stay ahead of the curve, fearful that Asian EM currencies could weaken even further if the Fed does begin its rate normalization policy next month.
In relative terms, the forex market has remained comparatively immune to the severe risk-off tone that is currently running through other asset classes. Broad forex volatility remains below its early July peak despite the VIX (fear gauge) spiking just shy of 30% on Friday (up +88% on the week). Do not be surprised to see an uptick in month-end August currency flows on the back of the weak equity markets.

The Week Ahead
The last full week of August will see many key data reports. Germany and the U.K report revised Q2 growth data, while tomorrow, Germany’s Ifo survey could cause a stir. Last week even stronger Japanese data could not sooth the investor; nevertheless, Japan will release its major economic numbers including consumer prices, retail sales, unemployment and household spending for July.
Stateside, it too is a relatively busy week that climaxes with Friday’s release of the core-PCE price index (the last look at prices before the September FOMC meeting). Tuesday is dominated by the housing sector (FHFA and Case-Shiller price reports). Pending home sales will follow on Thursday with the latest indication on existing home sales, while GDP is expected to be revised higher to +3.2%.
Then of course there is the Jackson Hole summit. There is considerable pressure on the Fed to be more transparent, especially when it comes to calibrating their rate policy. With the latest spike in market volatility, will the Fed hike rates in September and threaten three of its major objectives – price stability, full employment and financial stability? The market is looking for clues, but will they get them?

