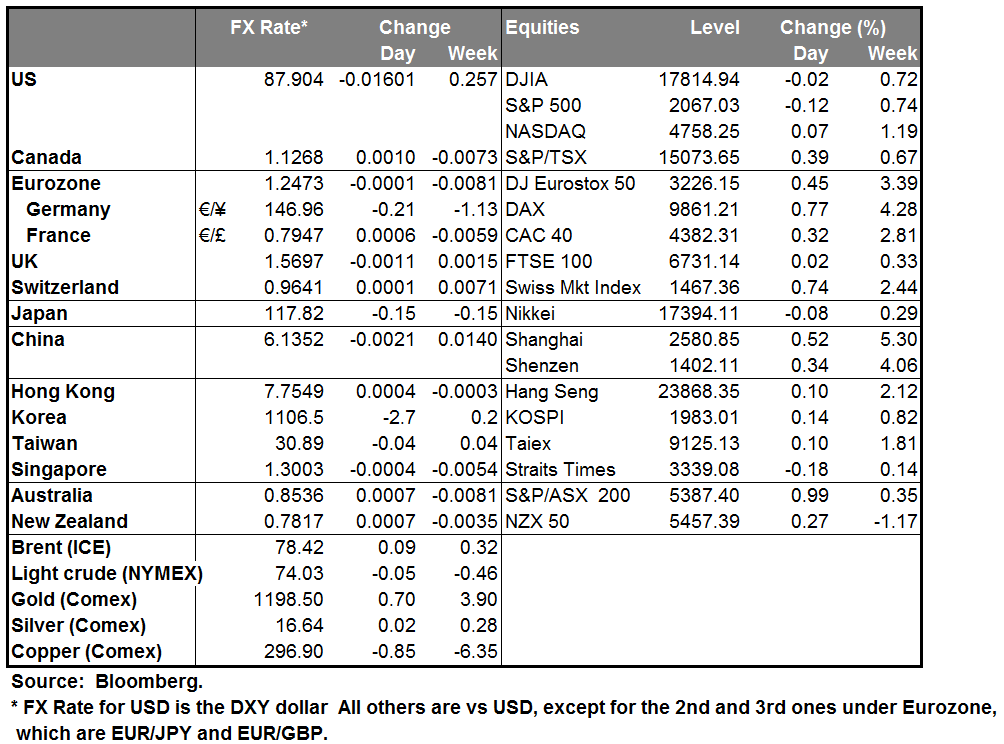
Oil prices slide ahead of OPEC meeting With just a day ahead of the Organization of the Petroleum Exporting Countries (OPEC) scheduled meeting in Vienna, impromptu talks between member nations Saudi Arabia and Venezuela with nonmembers Russia and Mexico ended without announcing any kind of agreement. On top of this, signals sent by individual member nations thus far suggest there is little consensus on whether and how to reduce output and stabilize prices. Benchmark West Texas Intermediate crude for January delivery fell to USD 73.60 a barrel, while Brent crude oil dipped to USD 78 a barrel on these developments. What could be agreed on Thursday is stricter enforcement of the existing production quota of 30 million barrels a day. Yet this is unlikely to be enough to reverse the fall by more than 30% since June in oil prices as there are no guarantees of any production cutbacks nor it is clear how non-OPEC members will react. It looks to us as if the decline in oil prices is likely to continue, particularly against the background of a slowing Chinese economy and stagnating European economy and continued high US domestic production.
On Tuesday, data showed that the US economy grew +3.9% qoq SAAR according to the 2nd estimate of the Q3 GDP, exceeding the initial estimate of 3.5% qoq SAAR. The forecast was for the figure to be revised down to +3.3% qoq SAAR. The 2nd estimate of the core PCE rate remained unchanged from the initial estimate, at +1.4% qoq SAAR. The economy in Q2 and Q3 posted its best back-to-back growth in 11 years, offering new evidence that the US entered the final quarter with a good head of momentum. On the other hand, the US consumer confidence index declined from its highest level since October 2007 and the Richmond Fed manufacturing index declined from an almost 4 year high. The mixed data weakened the dollar against most of its major peers. However, I would continue to view any USD setbacks as providing renewed buying opportunities, since the alternatives within the G10 are becoming less and less attractive.
Today’s schedule: Sweden’s economic tendency survey for November is expected to decline marginally from the previous month.
In Norway, the AKU unemployment rate for September is forecast to have remained unchanged at 3.7%. The official unemployment rate for the same month had declined, thus the possibility for a positive surprise is high which could be a bit NOK-supportive.
In the UK, the 2nd estimate of Q3 GDP is expected to show a +0.7% qoq pace of growth, in line with the preliminary estimate, confirming a modest slowdown in the country’s growth momentum. With this release we will get the expenditure details for the first time, which will give us more information about the Q3 growth. The release as forecast should be neutral for GBP.
A busy day in the US! Today we get durable goods orders for October. The headline figure is forecast to show a 0.6% mom fall, a slower decline than -1.1% mom in the previous month. On the other hand, durable goods excluding transportation equipment are estimated to rebound from September. Personal income and personal spending for October are also due out. Personal spending is forecast to have rebounded, fueled probably by income gains amid a stronger US labor market. Core PCE for October is expected to remain unchanged in pace from September on a mom basis, in line with the unchanged 2nd estimate of Q3 core PCE in Tuesday’s GDP figures. The Chicago purchasing manager index and the final University of Michigan confidence index, both for November, are also coming out. Pending home sales and new home sales, both for October, are likely to confirm that housing sector is growing again after a soft summer. All told, the data is likely to be USD-supportive and we would expect to see the dollar rally on the news.
In New Zealand, the trade deficit for October is forecast to narrow somewhat. Following yesterday’s fall in the 2-year inflation expectation rate, which makes a rate hike less likely, the moderate narrowing in the deficit will probably not be enough to reverse the negative sentiment towards kiwi and we remain bearish towards the currency.
We have only one speaker scheduled for Wednesday, ECB Vice President Vitor Constancio speaks.
The Market
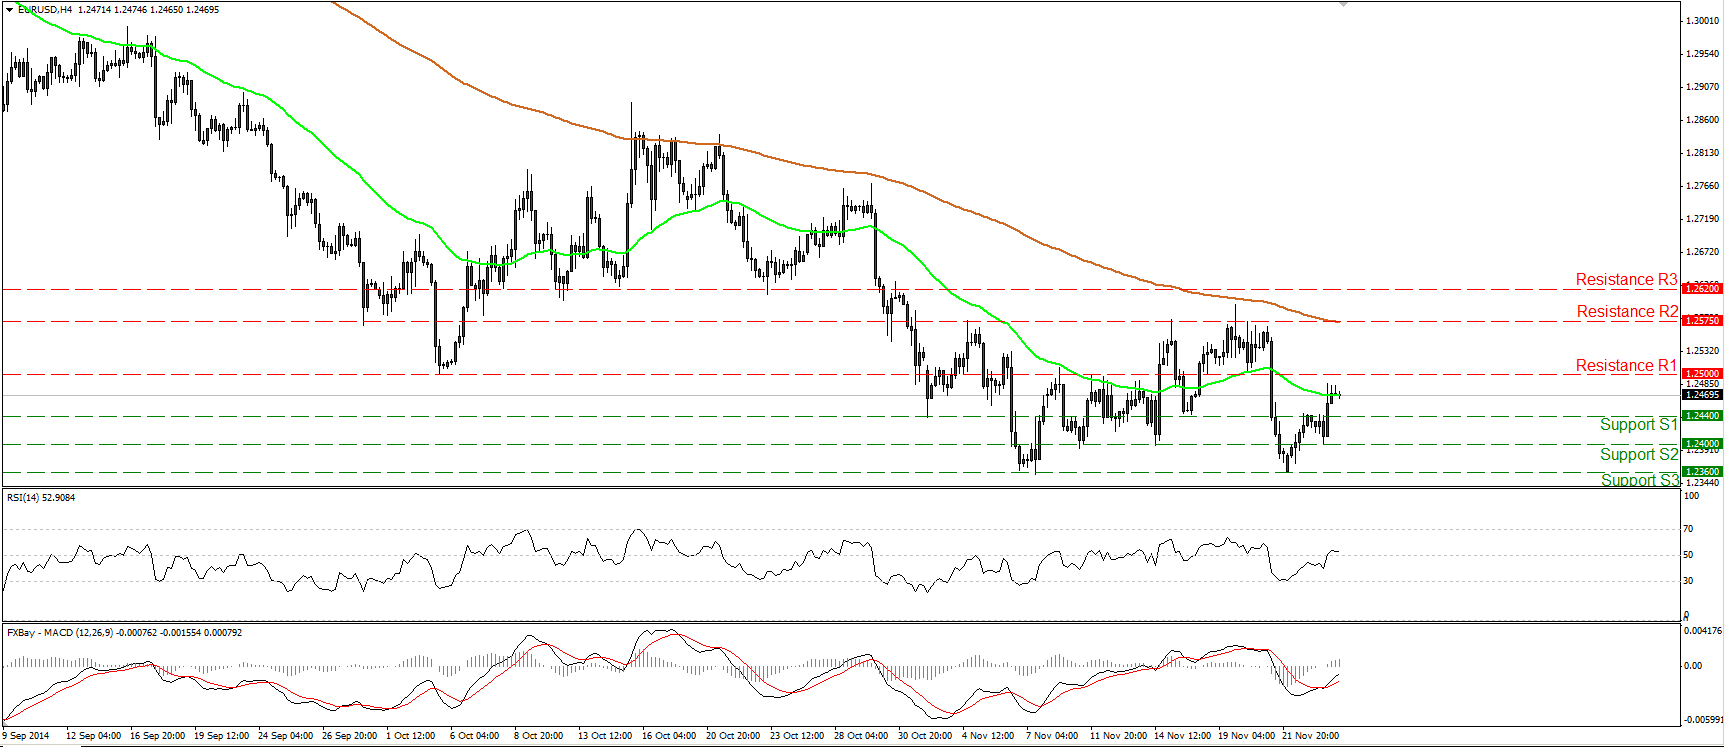
EUR/USD finds buy orders at 1.2400
EUR/USD tried to move lower after finding resistance at 1.2440, but it found buyers near 1.2400 (S2) and edged higher. The RSI moved above its 50 line, while the MACD, even though within its negative territory, lies above its trigger. Bearing these momentum signs in mind, I believe that the rebound may continue a bit more. However, on the daily chart, the overall path remains to the downside and I would expect the recent rebound or any extensions of it to provide renewed selling opportunities. Since I still see positive divergence between our daily oscillators and the price action, I would prefer to see a decisive dip below 1.2360 (S3) before getting more confident on longer-term downtrend. Such a break is likely to pave the way for the 1.2250 area, defined by the lows of August 2012.
• Support: 1.2440 (S1), 1.2400 (S2), 1.2360 (S3)
• Resistance: 1.2500 (R1), 1.2575 (R2), 1.2620 (R3)
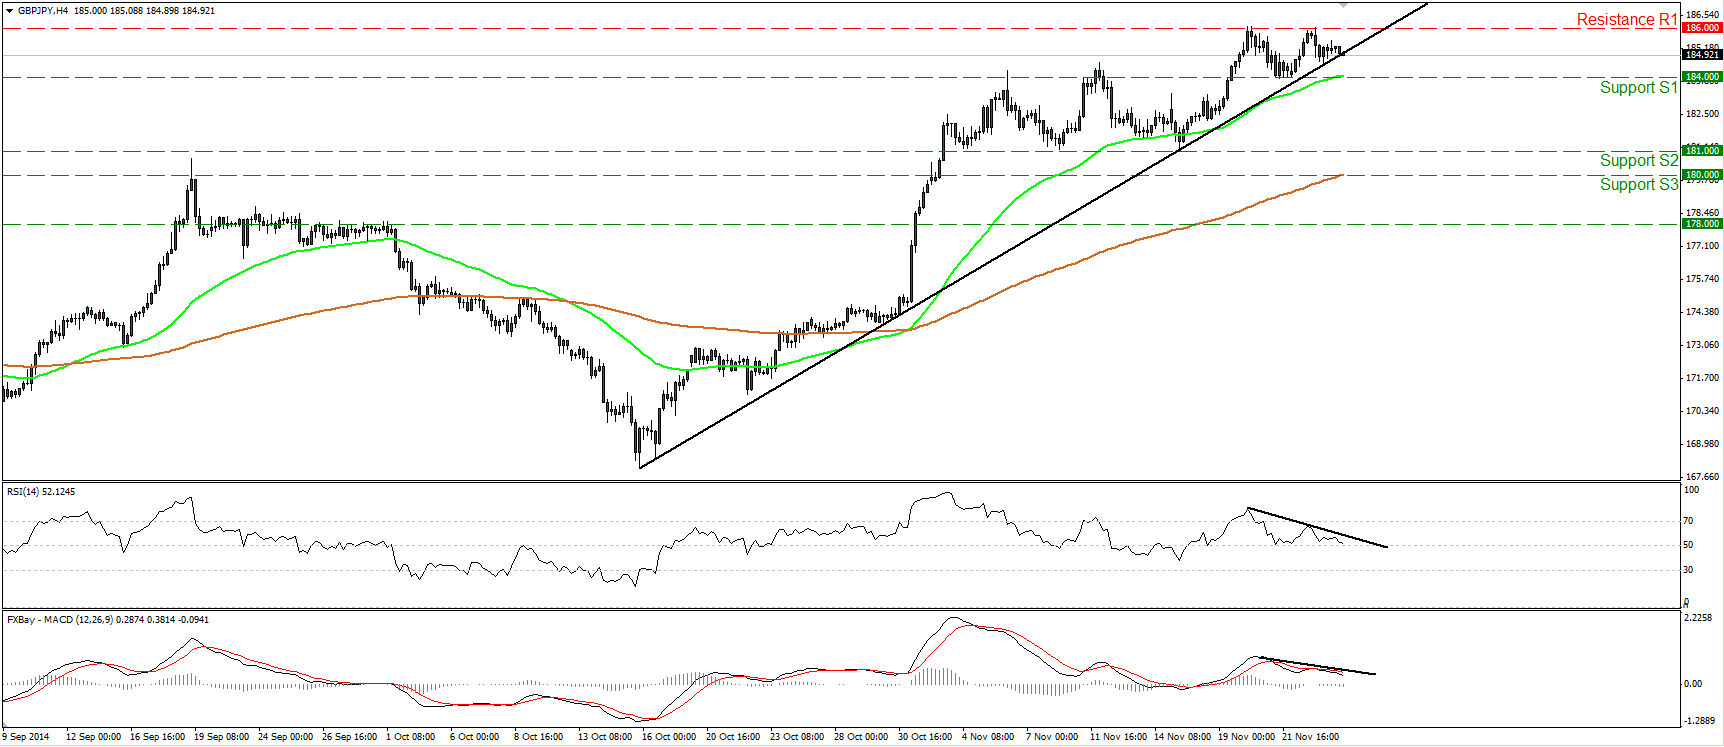
GBP/JPY ready to retrace
GBP/JPY failed to print a higher high and found again resistance near the 186.00 (R1) line. Today, during the early European morning, the rate is trying to break below the black uptrend line, taken from back at the low of the 15th of October. In my view, a dip below the 184.00 (S1) support is likely to reaffirm the case and perhaps signal the beginning of a downside corrective phase. Our momentum signs corroborate the possibility of such a move. The RSI moved lower and is now approaching its 50 line, while the MACD, although positive, stands below its signal line. Furthermore, I can spot negative divergence between both these indicators and the price action. On the daily chart, I still see a longer-term upside path, but our daily oscillators reveal upside weakness as well. The 14-day RSI exited its overbought conditions and moved lower, while the daily MACD shows signs of topping and could fall below its trigger any time soon.
• Support: 184.00 (S1), 181.00 (S2), 180.00 (S3)
• Resistance: 186.00 (R1), 189.00 (R2), 190.00 (R3)
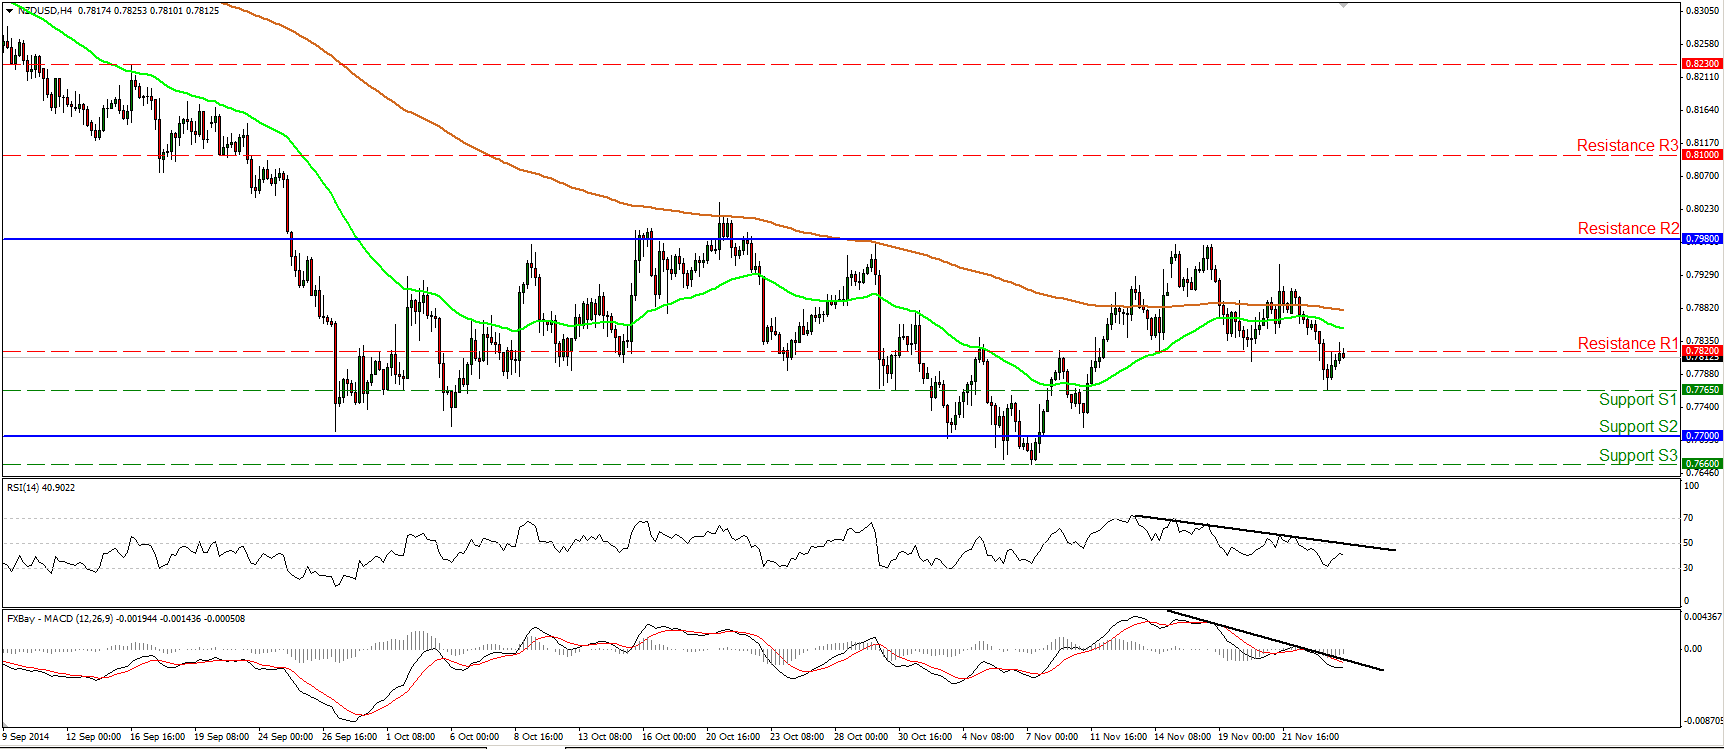
NZD/USD dips below 0.7820
NZD/USD fell below the support (turned into resistance) line of 0.7820 (R1) to complete a possible short-term “head and shoulders” pattern and to confirm the negative divergence between our momentum indicators and the price action. Although the pair found support at 0.7765 (S1) and rebounded afterwards to challenge 0.7820 (R1) as a resistance this time, I believe that one more down leg is looming and I would expect another test near the support area of 0.7700 (S2) after the bears pull the trigger. In the bigger picture, the rate oscillates between the 0.7700 (S2) support zone and the resistance of 0.7980 (R2), thus I see a sideways path longer-term.
• Support: 0.7765 (S1), 0.7700 (S2), 0.7660 (S3)
• Resistance: 0.7820 (R1), 0.7980 (R2), 0.8100 (R3)
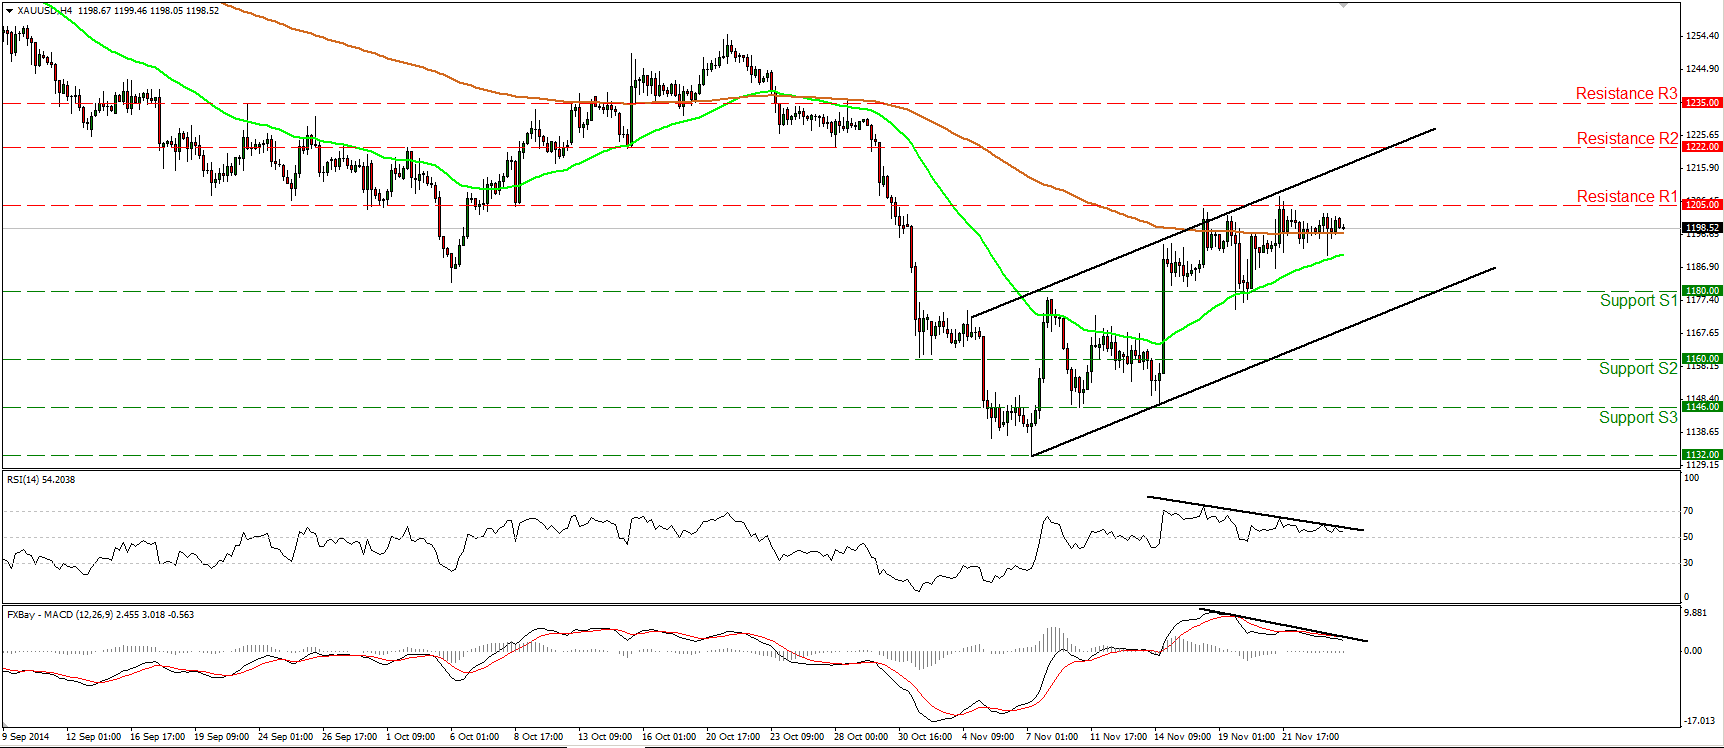
Gold still in a quiet mode below 1205
Gold continued its consolidative mode on Tuesday, staying below the 1205 (R1) resistance hurdle. With negative divergence between both of our near-term momentum studies and the price action, the possibilities for a short-term peak near the 1205 (R1) area are high. A possible pullback from the metal’s current levels could target the 1180 (S1) area or the lower boundary of the black upside channel. In the bigger picture, I still see a longer-term downtrend. Hence I would treat the recovery from 1132 as a corrective move for now. In the absence of any major bullish trend reversal signal, I would prefer to adopt a “wait and see” stance as far as the overall outlook of the precious metal is concerned.
• Support: 1180 (S1), 1160 (S2), 1146 (S3)
• Resistance: 1205 (R1), 1222 (R2), 1235 (R3)
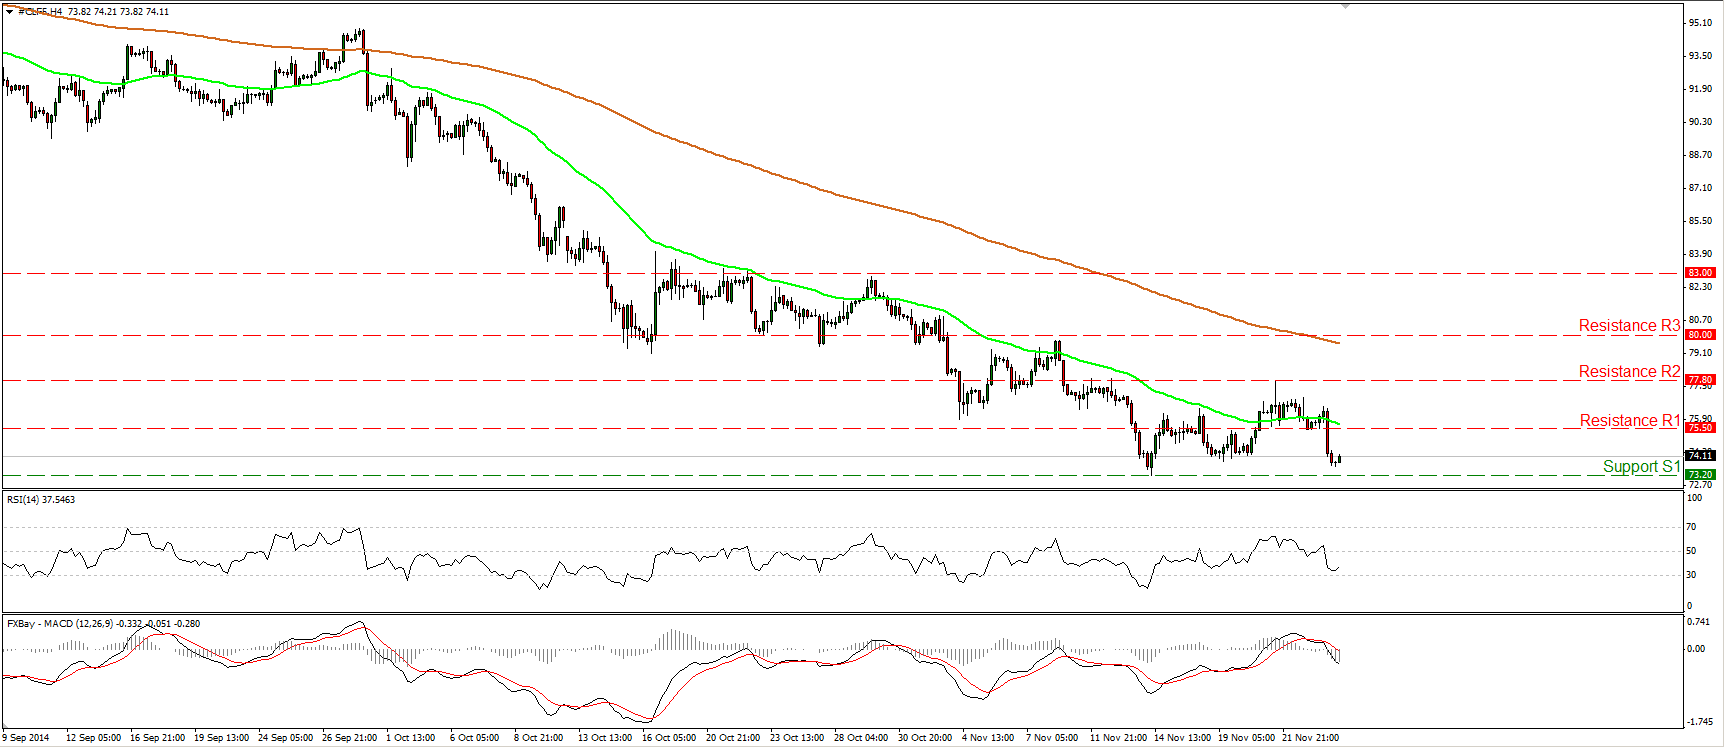
WTI falls sharply
WTI fell sharply yesterday on expectations that OPEC won’t cut output at its meeting Thursday, breaking below the 75.50 line, but the decline was halted above our support line of 73.20. On the daily chart, the price structure is still lower highs and lower lows below both the 50- and the 200-day moving averages, thus the overall path remains to the downside, at least for now. A clear move below the 73.20 (S2) support hurdle would confirm a forthcoming lower low and perhaps open the way for the 71.00 (S3) area, determined by the lows of July and August 2010.
• Support: 73.20 (S1), 71.00 (S2), 70.00 (S3)
• Resistance: 75.50 (R1), 77.80 (R2), 80.00 (R3)

