Economic Update for the month of March
Leading Indicators
Chart 1 & 2: US manufacturing continues to expand at more robust level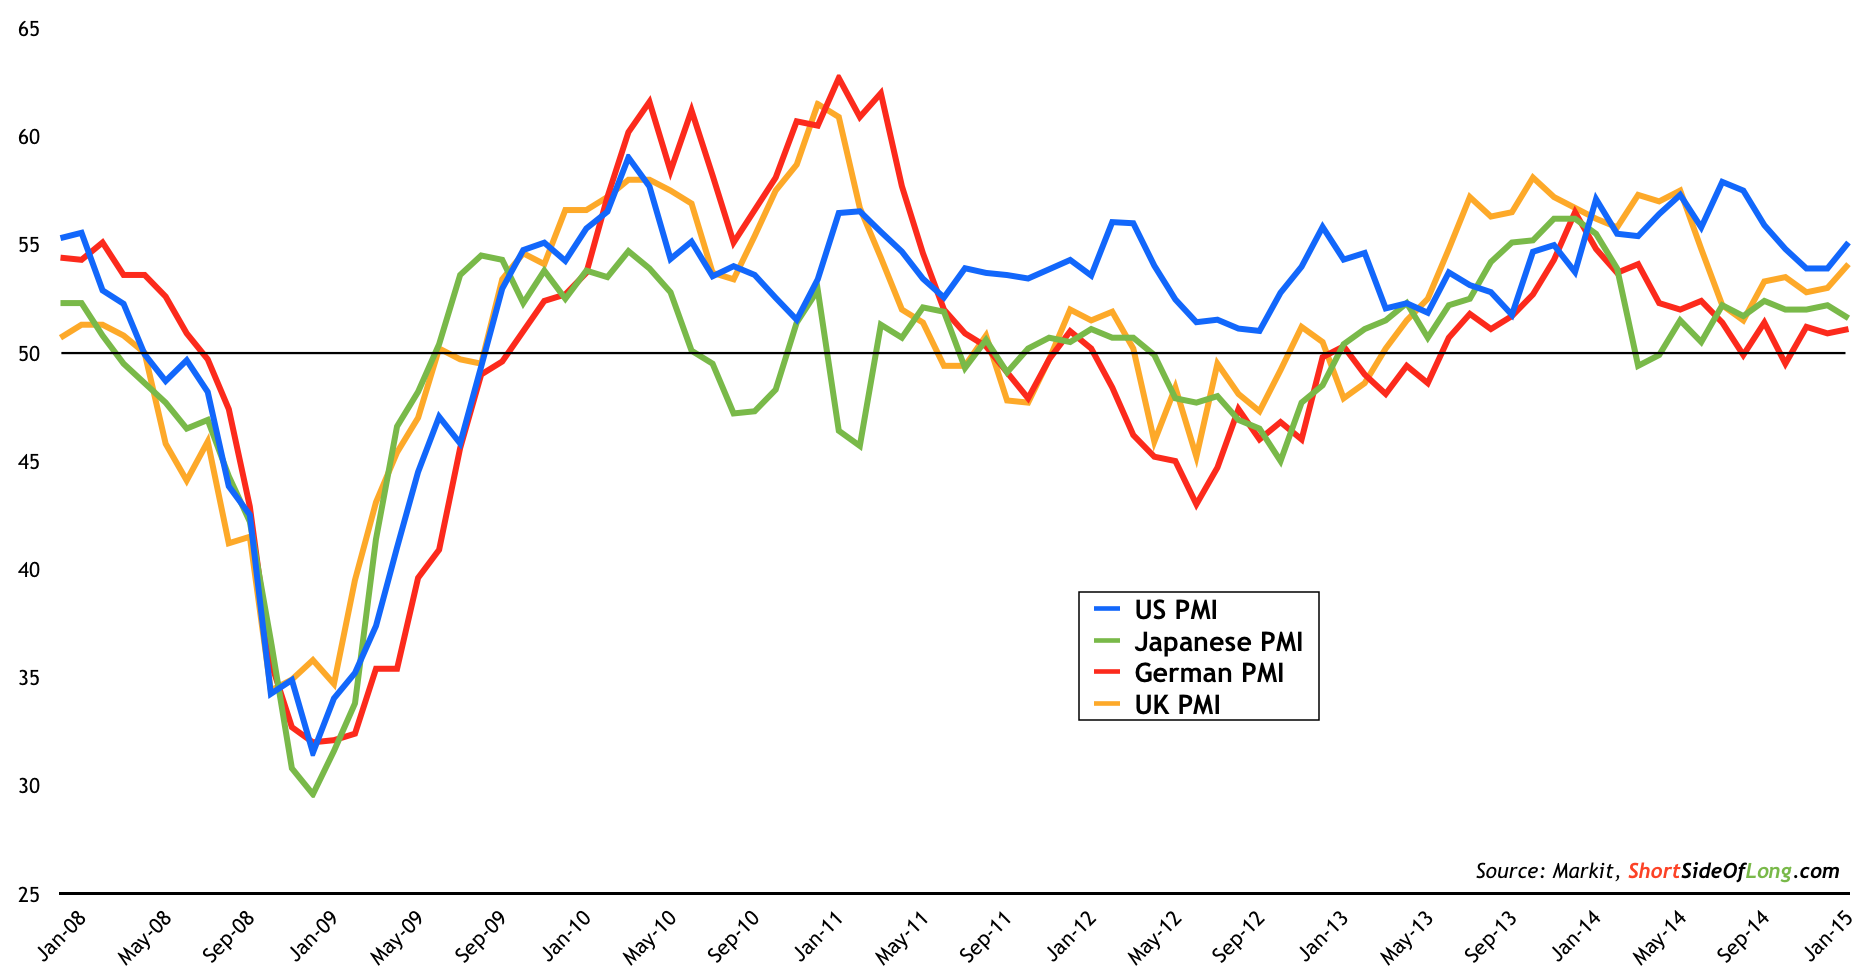
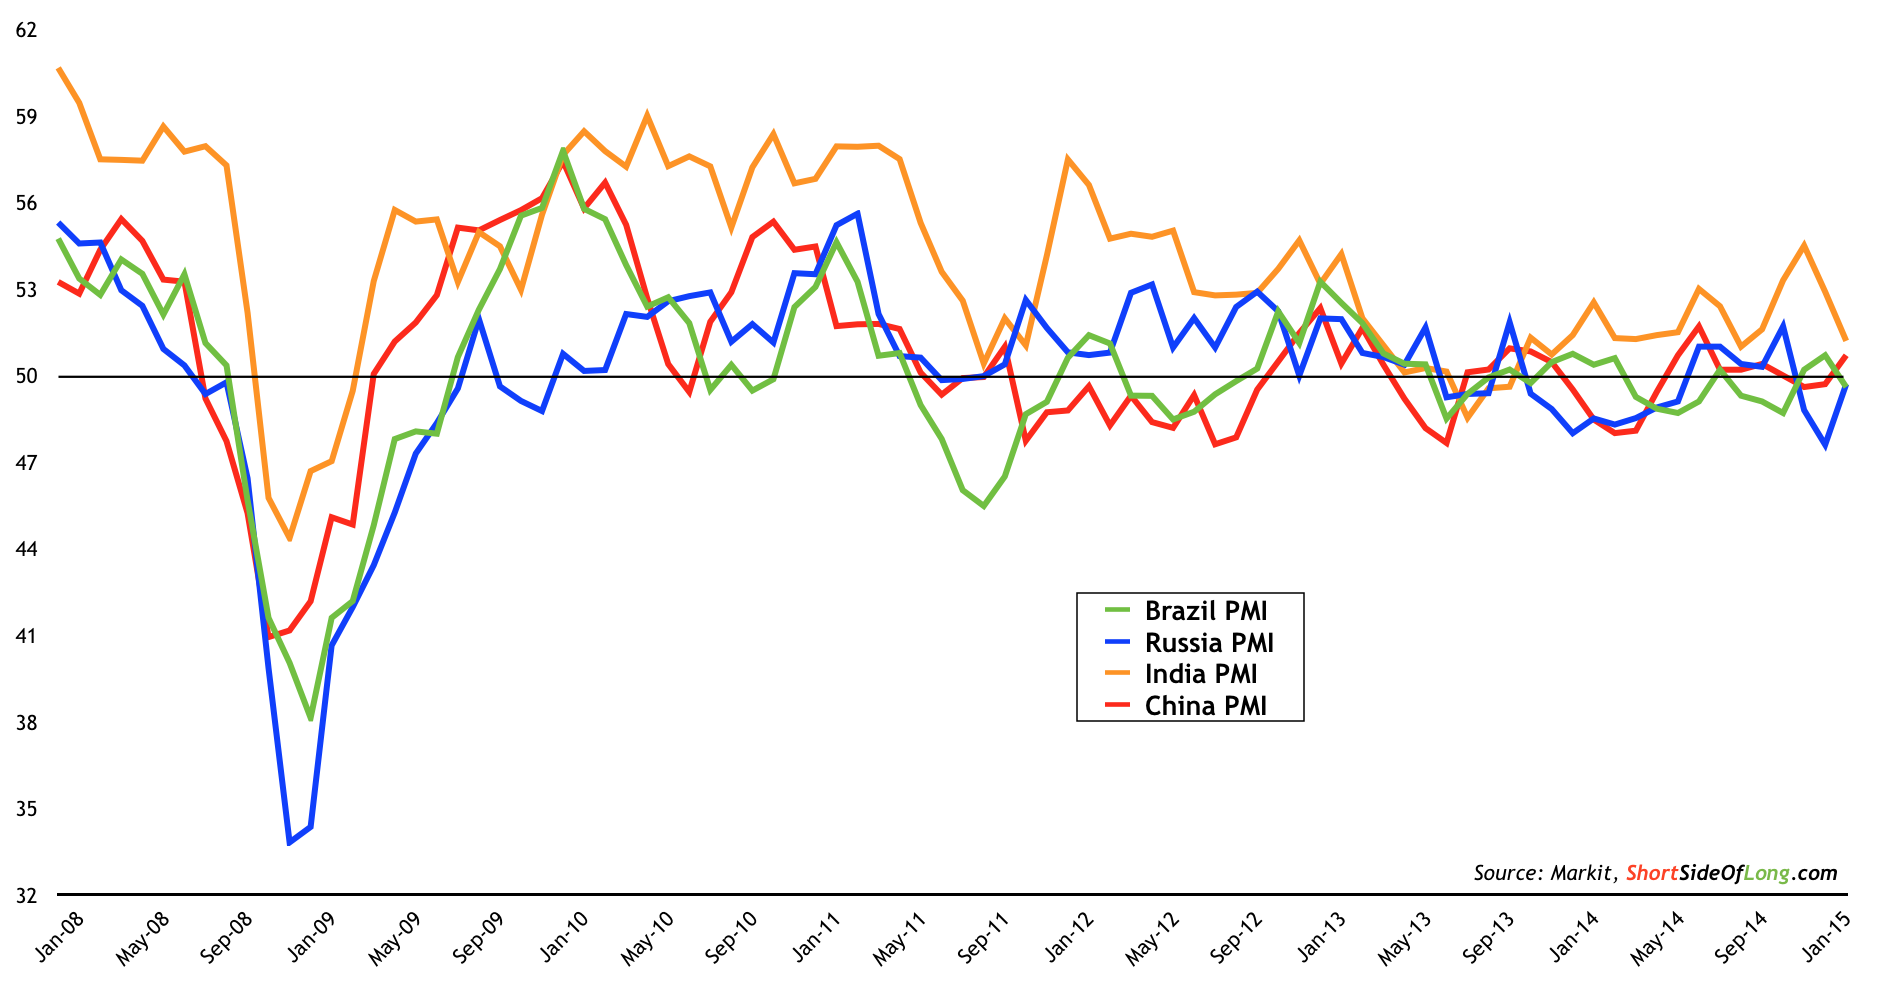
(Source: Short Side of Long)
- Recent Global Markit Manufacturing PMI data for the month of February showed continued global manufacturing expansion. Emerging markets continue to disappoint with expansion below trend, while developed markets and especially US show a more robust level of growth. Current developed economies PMI readings stand as following: US at 55.1, Japan at 51.6, Germany at 51.1 and UK at 54.1; while emerging economies PMI readings stand as following: China at 50.7, India at 51.2, Russia at 49.7 and Brazil at 49.6. Observing all of the charts above, Markit analysts highlight the following summary:
The global manufacturing sector expanded for the twenty-seventh consecutive month in February. The rate of output growth accelerated to a six-month high, as companies scaled up production to meet rising levels of new work and new export orders. The J.P.Morgan Global Manufacturing PMI rose to 52.0 in February, from 51.7 in January.
The US remained a prime driver of the global manufacturing upturn, as the US PMI rose to a four-month high. Growth was seen across much of the European manufacturing sector in February, with the strongest pockets of expansion registered in the UK. Growth was also signalled in Germany. Completing the picture of modest, yet broad-based expansion across the global manufacturing sector were the performances of the Asian nations. Mild growth was signalled in China and Japan.
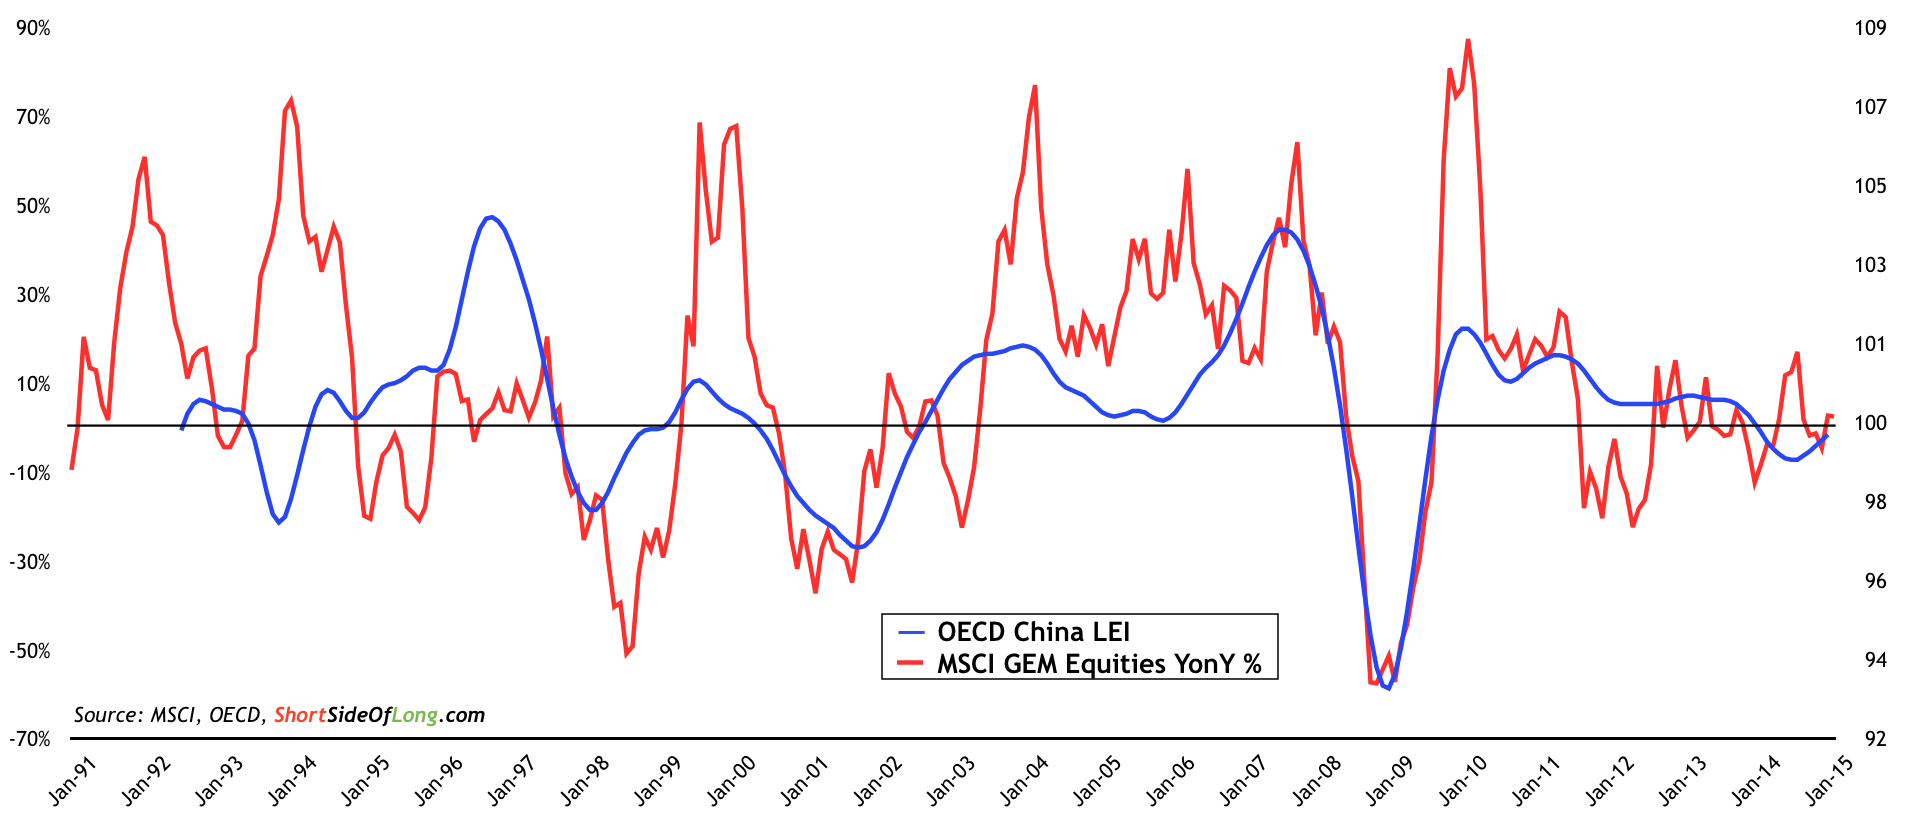
Chart 3: Chinese economic activity is showing signs of bottoming out
- Recent OECD Leading Indicators for the month of February showed a continued, but modest expansion in all major regions apart from China (click here for the chart). Nevertheless, after many quarters of slowing growth rate, Chinese OECD LEI is showing signs of possibly bottoming out. Investors should note that there is a very high positive correlation between Chinese growth and emerging market equity performance (refer to Chart 3), which are extremely cheap art present. Summarizing the overall report, OECD states that:
Composite leading indicators (CLIs) point to tentative signs of a positive change in growth momentum in the euro area, particularly in Germany and Spain. In Italy, the CLI also points to improvements, with this month’s CLI pointing to stable growth momentum compared to weakening momentum last month. The outlook for France is unchanged from last month’s assessment, with stable growth momentum anticipated.
The CLIs indicate stable growth momentum also in the OECD area as whole and in some of the major economies, including the United States, Canada, Japan, China and Brazil. In the United Kingdom, the CLI points to an easing in growth momentum, though from relatively high levels. The CLI for India indicates firming growth while in Russia the CLI continues to point to a loss in growth momentum.
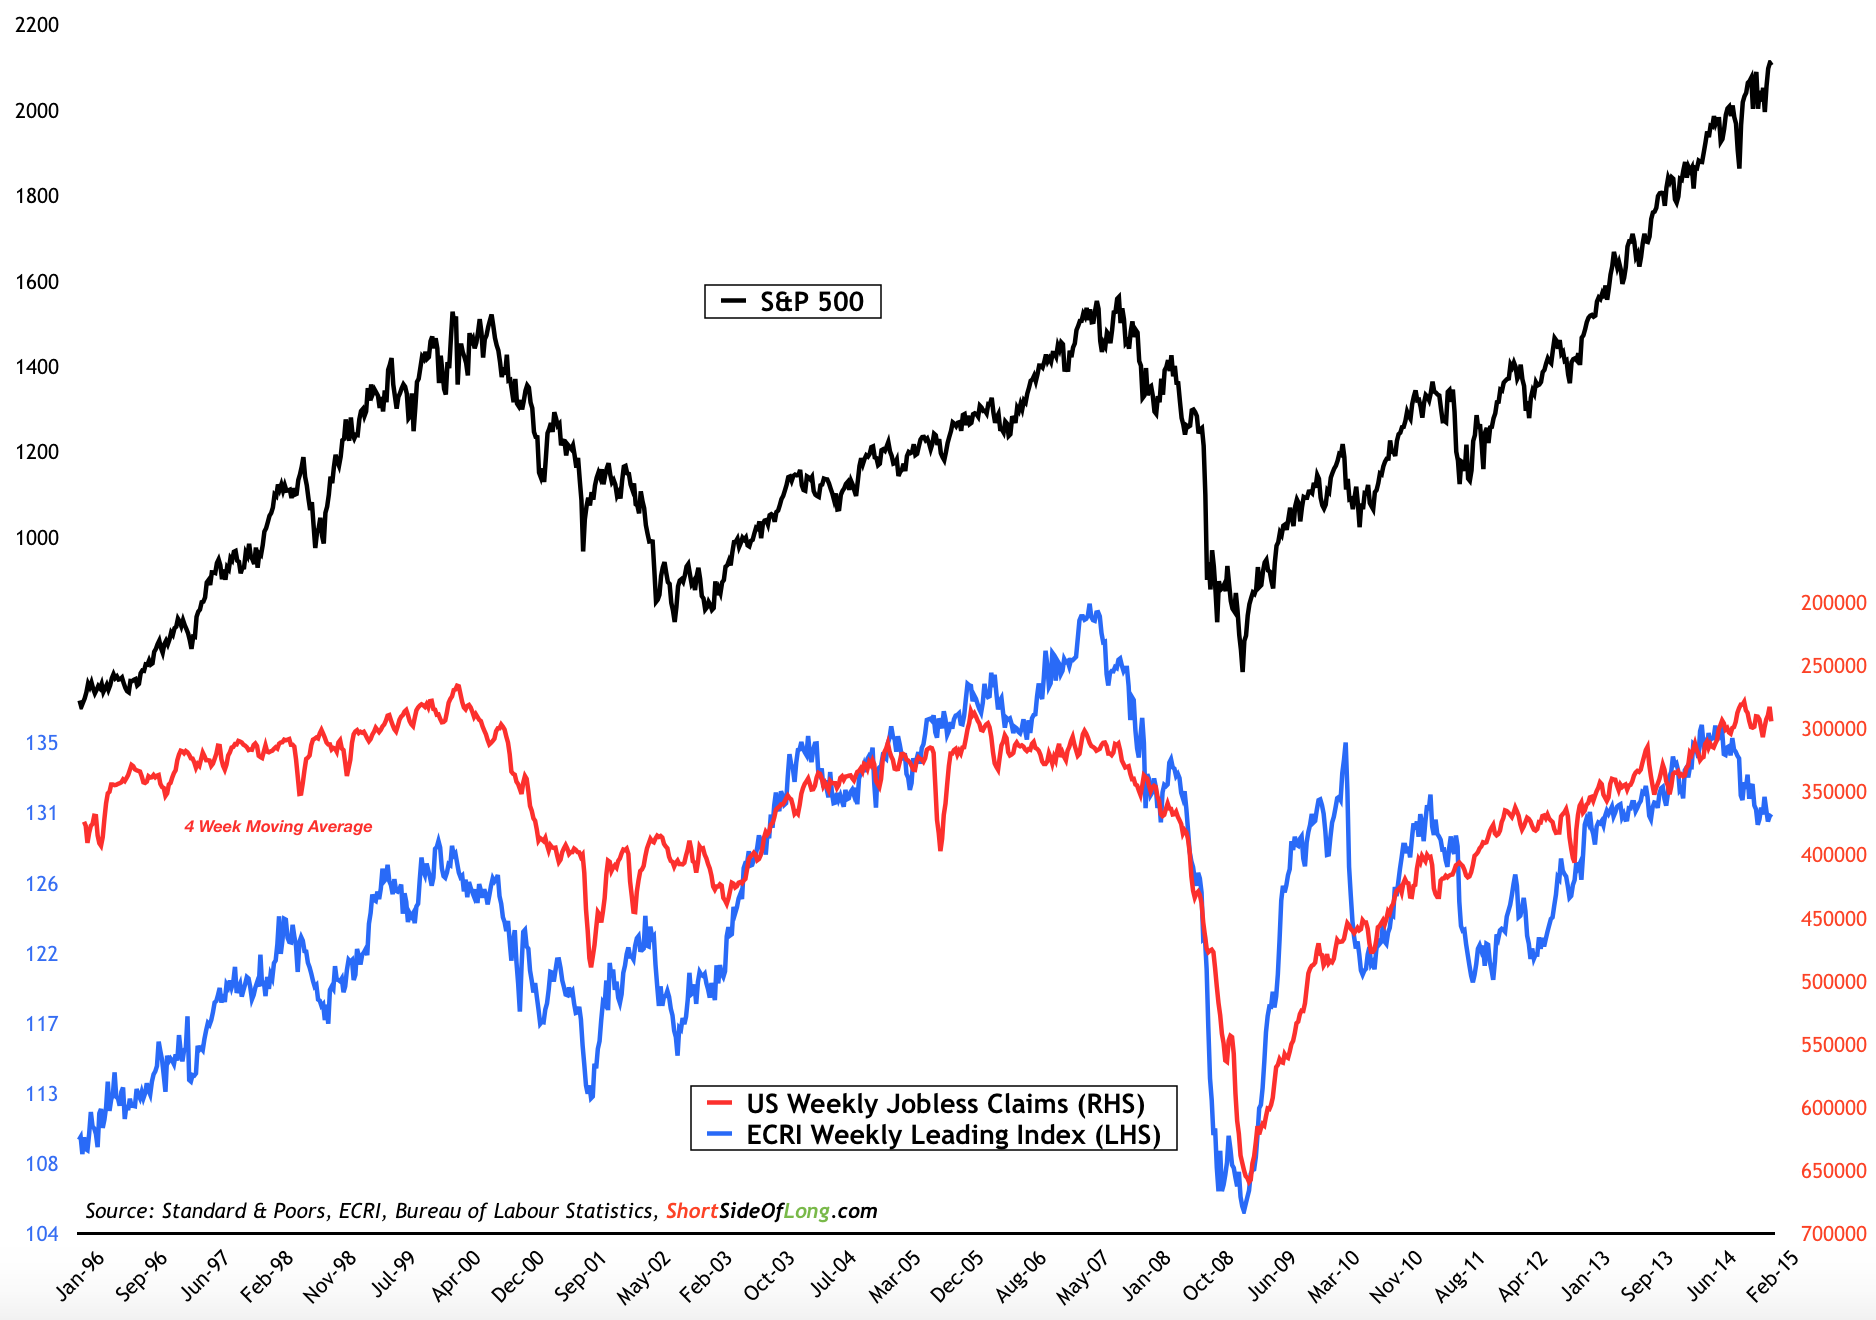
Chart 4: US leading economic indicators are giving us a mixed picture
(Source: Short Side of Long)
- United States is still by far the largest and most important global economy. That is why following US domestic leading indicators should be very influential in decision making for all global investors. The high positive correlation between S&P 500 equity index, ECRI's Weekly Leading Indicator and the Weekly Jobless Claims data has broken down in recent weeks. The stock market continues to march towards new record highs. At the same time, ECRI's Weekly Leading Index has been falling rather sharply, most likely due to the sell off in the Energy related high yield bonds (credit spreads widening). Finally, weekly jobless claims have stagnated since the summer of 2014.
Consumer Confidence
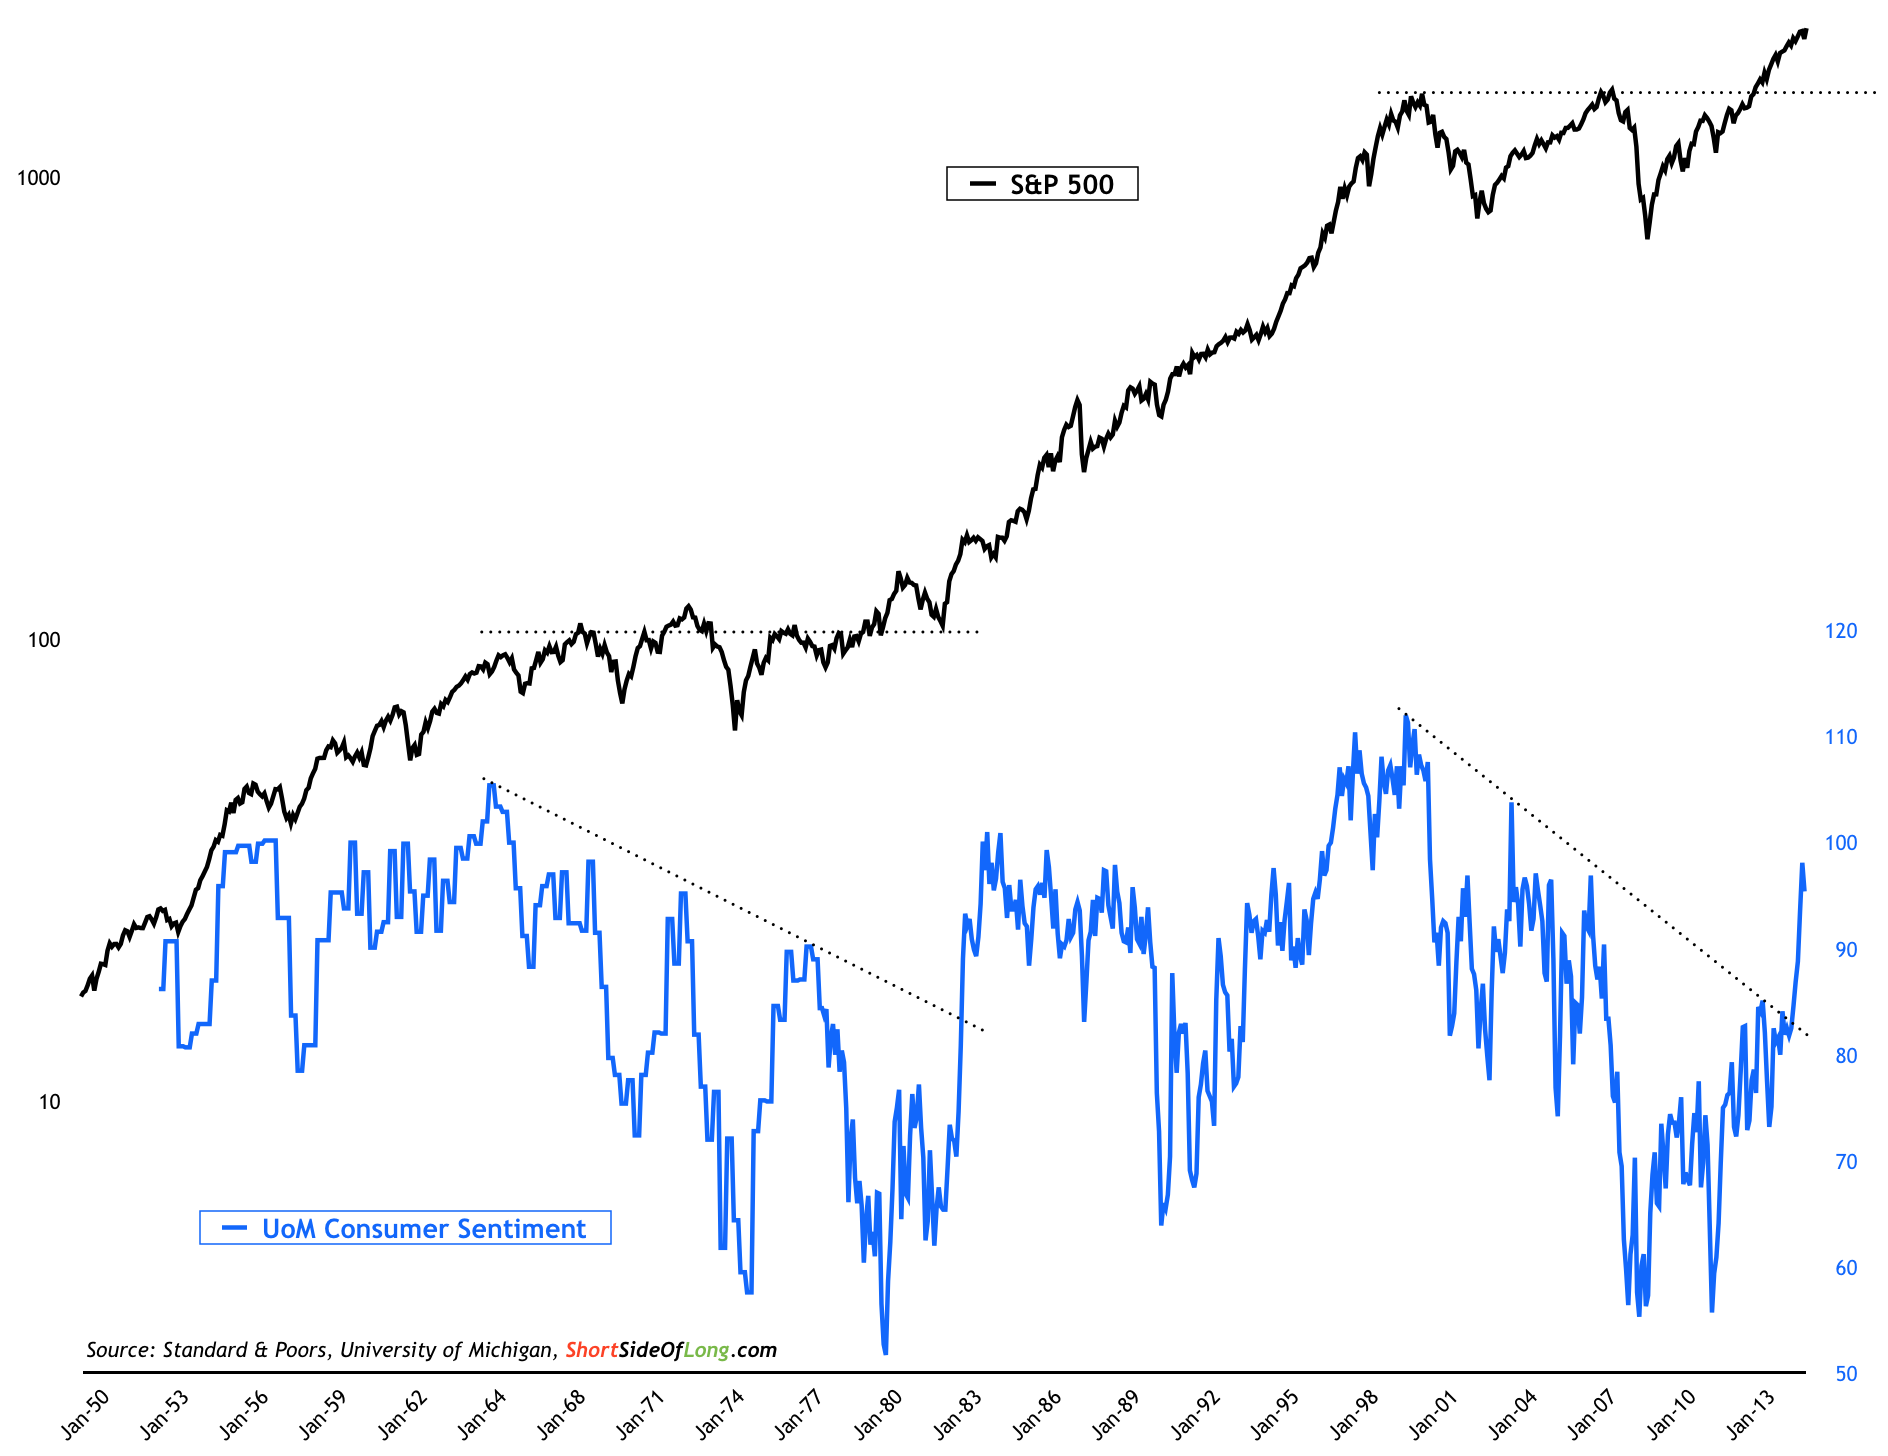
Chart 5: US public is getting optimistic on the stock market prospects
(Source: Short Side of Long)
- Uni of Michigan US Consumer Sentiment has broken out rather sharply since our last update in December. Current readings are at 95.4, which is an impressive improvement from a year ago when readings stood at 81.6. I have included a rather long term chart, which shows close similarities between 1966-1982 secular bear market and the current environment, from 2000 until present. One should be able to decide for him or herself, what the recent Consumer Sentiment spike might mean in both short to medium term, as well as in the long term. Note: Consumer confidence is one of the best contrary indicators to time long term equity purchases and sales. US Consumer Sentiment has averaged 86.7 over the last six decades, with a record high of 112 in January 2000 (during the tech bubble peak) and record low of 51.7 in May 1980 (during the high interest rate recession squeeze).
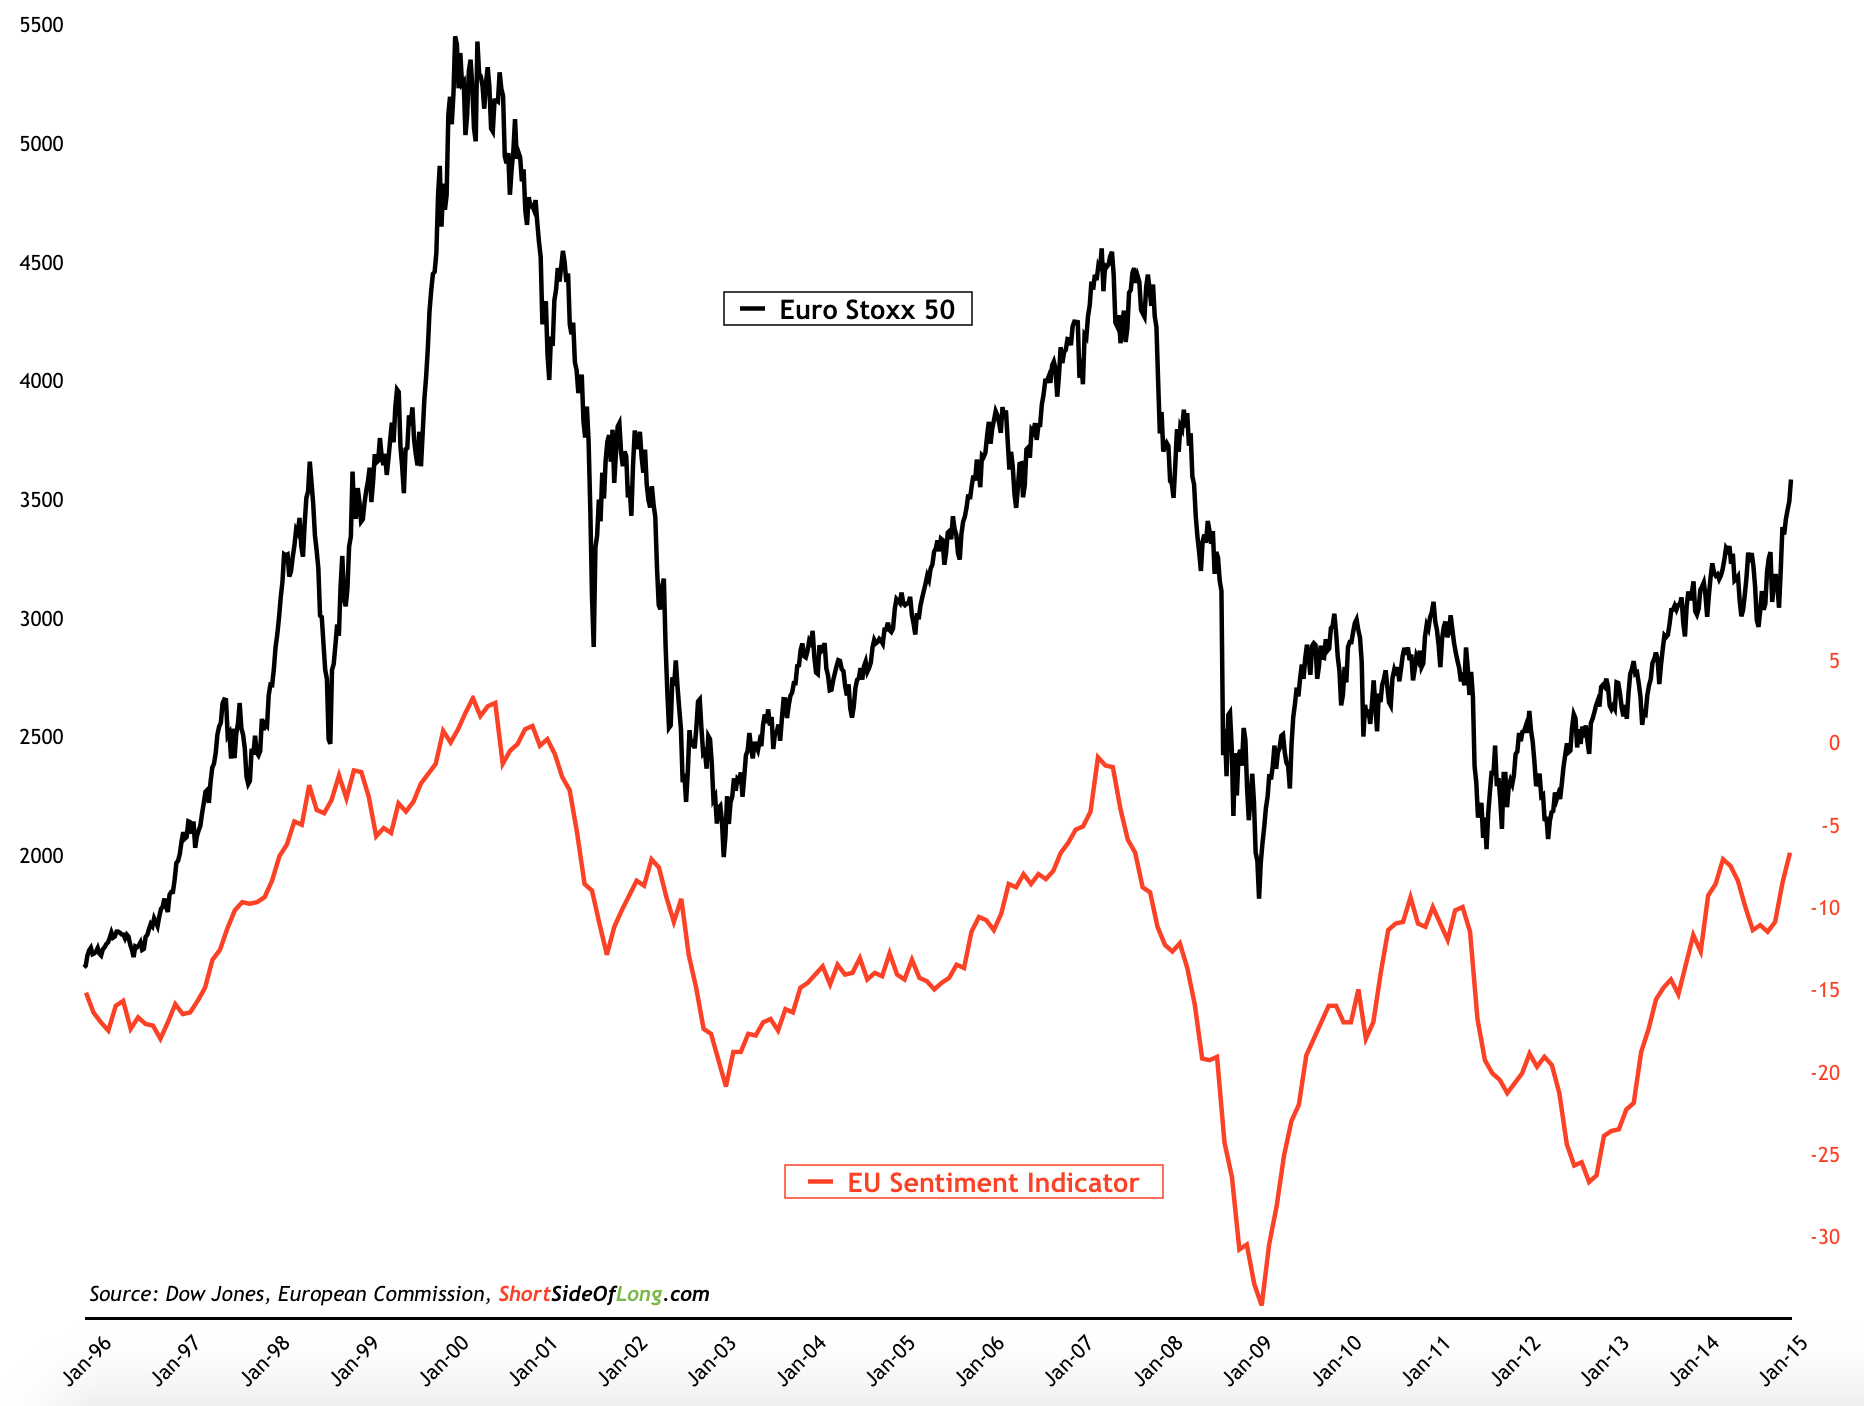
Chart 6: Eurozone consumer sentiment is improving as stocks break out
(Source: Short Side of Long)
- EU Sentiment Indicator has managed to recover as ECB launched its QE program. The chart above shows the current readings at -6.7, which is a modest improvement from a year ago when readings stood at -12.7. ECB's monetary efforts have diverted a more meaningful correction in Europe and now we have the stock market breaking out to new bull market highs. The economic expansion continues. Note: Consumer confidence is one of the best contrary indicators to time long term equity purchases and sales. EU Sentiment Indicator has averaged -12.7 over the last three decades, with a record high of 2.7 in March 2000 (during the tech bubble peak) and record low of -34.2 in March 2009 (during the GFC crash trough).
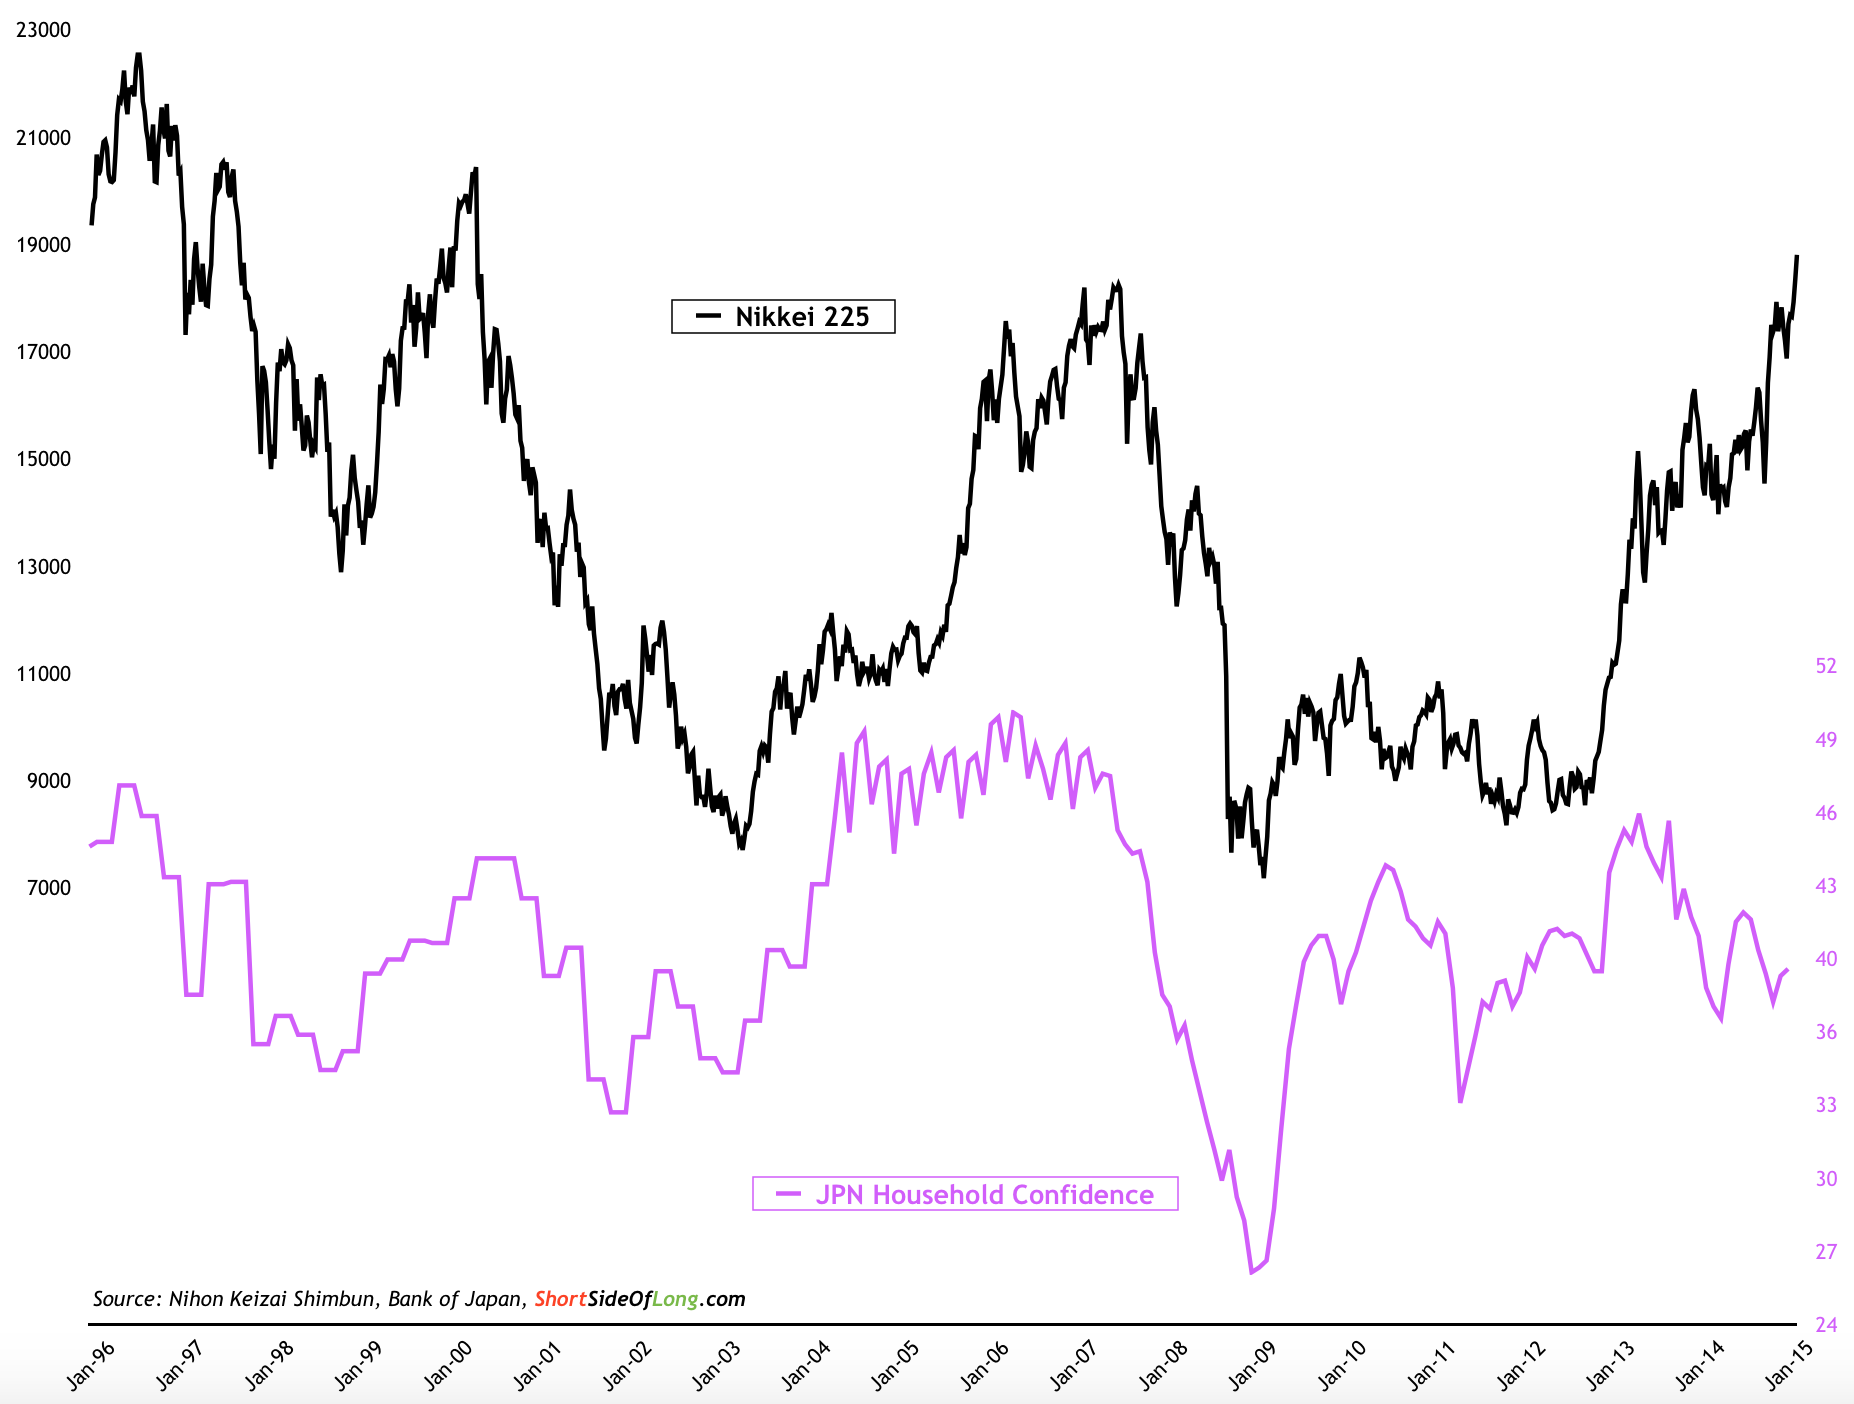
Chart 7: Japanese stocks lead the way, while consumers don't feel it
(Source: Short Side of Long)
- Japanese Household Confidence remains subdued, despite the fact that the stock market is rising almost vertically. Cabinet Office of Japan releases the data one month behind, so focusing on January readings, we saw readings come in at 39.1, which is basically showing no change from a year ago. As stated many times before, investors should be paying attention to the market rather then lagging indicators. While not perfect, we can clearly see in Chart 7 that Nikkei tends to lead consumer confidence. Note: Consumer confidence is one of the best contrary indicators to time long term equity purchases. Japanese Household Confidence has averaged 42.4 over the last three decades, with a record high of 50.8 in December 1988 (during the Japanese bubble peak) and a record low of 27.4 in January 2009 (during the GFC crash trough).

