
After having kept us on the edges of our seats for almost two years, we have witnessed a major plot twist our Greek soap opera! The Eurogroup has finally agreed to disburse the 130 billion euro promised to Greece. This should give the country enough leeway to restructure its public finances and escape financial ruin in the short term. Many unanswered questions remain, however, which leads us to believe that what we are experiencing now is just the eye of the hurricane. The most important political event expected this week is the holding of a second LTRO (Long Term Refinancing Operation). Essentially, Mr. Draghi’s goals for the first round, held on December 21, were to inject capital into Eurozone banks to encourage lending to the private sector and lower the interest rates demanded on the sovereign debt of Eurozone countries.
Canada
Very little news is expected in Canada this week, but it does feature two important items. The week begins with the release of Current Account figures on Thursday. Analysts expect the trade balance to show a $9.6 billion deficit. On Friday data on Canadian GDP for the month of December will be released. Analysts expect a level of 0.3%.
United States
A wide range of important economic data is expected south of the border this week, beginning on Tuesday with statistics on Core Durable Goods Orders for the month of January. Then on Wednesday the annualized change in GDP for the fourth quarter will be released, followed by the Beige Book survey of economic conditions. On Thursday we will have the ISM Manufacturing Index for the month of February. Economists expect it to come in at 54.6; a figure above 50 indicates economic expansion. Also on Thursday we can expect data on personal spending, an indicator of the confidence of U.S. consumers.
International
An important week for international news begins Monday with a vote held by the German Parliament on the Greek bailout package. The unveiling of data continues Tuesday with the Business and Consumer Survey for the Eurozone. Also on Tuesday, the Consumer Price Index of Europe’s largest economy, Germany, will be released. On Wednesday Germany will release employment data, and the inflation index will be revealed. As mentioned above, the ECB will set in motion its second LTRO. We are anxious to see whether European banks will show as much interest as last December, where 523 banks took part in the program and borrowed 489 billion Euros. Before our business day begins on Thursday, China and the euro zone will have revealed their Purchasing Managers Index and the Eurozone will have released inflation data. The week of international news will end with a European summit on Thursday and Friday where the future of their EFSF and ESM funds will be discussed.
The Loonie
"You cannot change your destination overnight, but you can change your direction overnight."
Financial markets are increasingly unpredictable. Over the last few months, even things we consider set in stone seem to have trouble taking their natural course. For example, lately the price of crude oil appears less correlated with the Canadian dollar. As the following graph makes clear, since November 2011, there seems to have been a serious break in the strong trend linking crude oil (WTI) and our Canadian dollar. It should be noted that under an international currency agreement, CAD/USD means the price of a Canadian dollar expressed in U.S. dollars, in contrast to the USD/CAD rate, which is the one usually used in transactions.
A positive correlation returned in December, only to evaporate in January and February. On the one hand, recent macroeconomic developments appear to be having much more of an impact on the loonie than the price of oil. Recent moves to resolve the European crisis are keeping all market participants on their toes. On the other hand, tensions in Iran are driving the price of crude oil up to levels not seen since May 2011. Since in finance everything affects everything else, on Friday we saw the TSX reach its highest level in six months.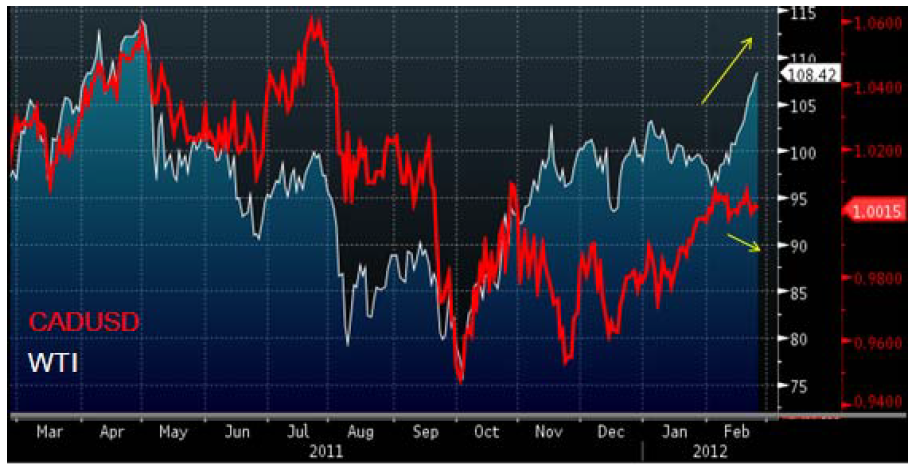 CAD/USD" title="CAD/USD" width="913" height="468">
This is a cause for concern if your business requires you to manage both your currency risk and your purchasing risk when they are both impacted by oil and commodity prices. Perhaps this is the art of managing all financial risks, but in fact the trick is to just deal with one aspect of the problem at a time. Your trader can help. Good hunting!
Technical Analysis: Applying the Elliot Wave Principle to the SP500 (Friday, February 24, 2012)
USD/CAD: From a technical point of view it was a quiet week for the North American pair. The rate spent most of the week in a channel barely 120 points wide.
SP500: The following graph presents changes in the SP500 index over the last three years. According to the wave theory developed by Mr. Elliott, markets move in waves. First, the theory states that upward movements consist of 5 waves; 1-3-5 moving up and 2-4 on the downside. Second, the theory states that the corrections that follow consist of 3 waves; a-c going down and b going up. We have identified two complete examples of this pattern over the last three years, and it appears that we are now at point 3 in an upward wave. This suggests that there will be a correction, with an objective of 1.290, before another impulse wave can begin.

Fixed Income
Bond yields ended slightly lower for the week, mostly impacted by the demand for fixed income assets worldwide. In the absence of significant economic data on the domestic market, investors remained cautious, while focusing on news from countries with correlated markets.
The mood was positive early Tuesday, after the long week-end of the Presidential Holiday. Yields increased, mostly in reaction to additional supply of 2y treasuries in the US, as well as positive developments in the negotiations to help Greece avoid default.
Thursday, economic news from Germany brought some support for treasury yields, but rates ended lower after the U.S. government completed another bond issue that attracted more demand than anticipated. Investors will get more economic news this week, including key GDP data from both the US and Canada, respectively Thursday and Friday. On the politics side, they will also keep an eye on the situation with Iran and its alleged uranium enrichment program. Oil prices tend to impact Canadian stocks, and further increases could impact bond yields through portfolio recalibration and inflation expectations.
Commodities
Last week proved to be very turbulent for the energy market. Of course, our attention was on the showdown between the West and Iran. Given that a solution to the conflict is apparently still out of reach, the bullish trend may continue for some time, maybe all the way to record high prices. Should the situation deteriorate further, we may well see a spike similar to that of 2008. Many businesses have implemented hedging strategies over the last few days, and this week stands to be a busy one. As we have often said over the last few months, businesses wanting to implement strategies for 2013 should use the price of Brent crude (in $CAD) as their primary benchmark index. This approach has already been implemented by some of our largest clients, and it is much better than having no protection in place at all.
Last Week at a Glance
Canada – In December, retail sales dipped 0.2% in line with consensus expectations for a first drop in five months (chart). The decline was driven in part by weak auto dealership revenues, which fell 1% in the month. Excluding autos, sales held even as gains in furniture (+3.2%), building materials (+2.4%) and food/beverages (+1.2%) counterbalanced losses elsewhere, including in gasoline (-1.1%), clothing (-0.8%), sporting goods (- 3.4%) and electronics (-2.8%). In real terms, retail sales remained level. Despite December’s flat volumes, real retail sales were up 5.3% annualized in 2011Q4, their largest leap since 2010Q1. This heralds a decent contribution from consumption spending in the quarter. What’s more, the spending spree on durables seems to have carried over into January if preliminary estimates for auto sales are an indication (+16% m/m). This flies in the face of recent tepid employment figures and high gasoline prices. Gasoline’s share of total retail sales averaged 12.6% in Q4, its highest level since the energy price spike of 2008Q3. However, this did not prevent discretionary retail spending from accelerating at a new high in Q4. Still in December, wholesale trade rose 0.9%, overshooting consensus expectations for a 0.6% jump. Most subsectors registered advances, including autos (+3.4%) and building materials (+0.7%). These more than offset lower sales in the volatile farming products category (-4.5%). In real terms, wholesale trade grew 1.3%. For December, the real manufacturing gains reported earlier and better wholesale volumes can be expected to offset the softness in retailing. This should translate into GDP growth of 0.2% or so in the month. For 2011Q4 as a whole, it looks like growth will approach the Bank of Canada’s estimate of 2% annualized. Canada's survey of employment, payrolls and hours (SEPH) completed by businesses painted a much brighter picture of Canadian employment than the more closely watched Labour Force Survey (LFS). The SEPH data showed that Canada gained 3300 jobs in December (instead of losing 8700 paid jobs as per the LFS). This was the fifth month in a row that the SEPH reflected a better employment situation than did the recently revised LFS paid jobs component (16K jobs/month more on average than the LFS over August-December). According to the SEPH, average weekly earnings rose 0.7% in the last month of the year, bringing the year-on-year gain to 2.4%. Hours worked were unchanged in the month, which means that higher earnings were due to wage growth. For 2011Q4 as a whole, average weekly hours rose at an annualized 1.32%, their fastest pace since 2011Q1. This contrasts with the drop in hours worked in the quarter reported in the LFS. Weekly earnings were up 5.7% annualized in 2011Q4, their highest point since 2007Q2. For 2011 as a whole, weekly earnings grew a decent 2.6%, after increasing 3.5% the year before. The SEPH data are more consistent with other Q4 macro data (e.g., retail spending, confidence, housing) than the LFS is. Quebec is the primary source of disagreement between the two surveys. In 2011Q4, the LFS had Quebec shedding 61000 jobs while the SEPH indicated a gain of 6000 paid jobs. The SEPH data seem to convey an image of the labour market that is more in line with the Quebec GDP report, which has real GDP at basic prices holding steady in both November and October. Corporate Canada closed 2011 on very solid footing. According to Statistics Canada, corporate profits rose 9% sequentially in Q4, their best showing in two years. The manufacturing sector’s performance was even more impressive as factory operating profits excluding petroleum and coal products soared 18.1%. While motor vehicles and parts accounted for roughly two-thirds of this surge, the fact remains that nine of the twelve major industry groups recorded higher earnings. The level of factory profits in Canada stood at an 11-year best in Q4. Profit margins, for their part, shot up to their highest mark since 2000Q4. This is quite an achievement considering that 11 years ago, the loonie was worth only 65 cents U.S. as opposed to trading at par today. This suggests that earnings growth in Canadian manufacturing is driven more and more by productivity gains instead of a cheap currency.
United States – In January, existing-home sales sprang 4.3% to an annual pace of 4.57 million units. December sales were revised down 0.5% to a 4.38-million pace. Distressed properties accounted for 35% of total sales in January, compared with 32% the prior month. Sales were up in all regions, with the West posting the strongest progression (8.8%) and the Midwest bringing up the rear (+1.0%). The supply of existing homes for sale stood at 6.1 months. Still in January, new-home sales reached 321K, exceeding the 315K generally expected. Moreover, December sales were revised up from 307K to 324K. In the past six months, new-home sales have picked up at an annualized pace of more than 18%, which suggests that the U.S. housing market is on the mend. Separately, the Michigan Consumer Sentiment Index for February was revised upward to 75.3 from 72.5. Initial jobless claims reached 351K, unchanged from the prior week's upwardly revised figure. This is still the lowest number since March 2008. The more stable four-week moving average sank to 359K, also a multi-year low. Continuing claims dropped to 3.39 million, their lowest level since August 2008. The fact that the upbeat initial jobless claims readings were in the reference week for the non-farm payrolls survey gives us reason to be optimistic about net job creation in the United States in February. The downtrend in jobless claims is supportive of further triple-digit gains in U.S. non-farm payroll employment. Hence, it would come as no surprise to see another reading in the 200s.
Euro area – A survey of purchasing managers in the euro area showed that activity in both the services sector and the manufacturing sector shrank in February. The services index slid to 49.6 from 50.4 while the manufacturing index came in at 49. This left the composite PMI flash estimate at 49.7 for the month, down from 50.4 in January. In a separate report, Eurostat indicated that industrial orders rose 1.9% in December after shrinking 1.1% the previous month.
- English (UK)
- English (India)
- English (Canada)
- English (Australia)
- English (South Africa)
- English (Philippines)
- English (Nigeria)
- Deutsch
- Español (España)
- Español (México)
- Français
- Italiano
- Nederlands
- Português (Portugal)
- Polski
- Português (Brasil)
- Русский
- Türkçe
- العربية
- Ελληνικά
- Svenska
- Suomi
- עברית
- 日本語
- 한국어
- 简体中文
- 繁體中文
- Bahasa Indonesia
- Bahasa Melayu
- ไทย
- Tiếng Việt
- हिंदी
Major News this Week
Published 02/28/2012, 07:17 AM
Updated 05/14/2017, 06:45 AM
Major News this Week
Latest comments
Loading next article…
Install Our App
Risk Disclosure: Trading in financial instruments and/or cryptocurrencies involves high risks including the risk of losing some, or all, of your investment amount, and may not be suitable for all investors. Prices of cryptocurrencies are extremely volatile and may be affected by external factors such as financial, regulatory or political events. Trading on margin increases the financial risks.
Before deciding to trade in financial instrument or cryptocurrencies you should be fully informed of the risks and costs associated with trading the financial markets, carefully consider your investment objectives, level of experience, and risk appetite, and seek professional advice where needed.
Fusion Media would like to remind you that the data contained in this website is not necessarily real-time nor accurate. The data and prices on the website are not necessarily provided by any market or exchange, but may be provided by market makers, and so prices may not be accurate and may differ from the actual price at any given market, meaning prices are indicative and not appropriate for trading purposes. Fusion Media and any provider of the data contained in this website will not accept liability for any loss or damage as a result of your trading, or your reliance on the information contained within this website.
It is prohibited to use, store, reproduce, display, modify, transmit or distribute the data contained in this website without the explicit prior written permission of Fusion Media and/or the data provider. All intellectual property rights are reserved by the providers and/or the exchange providing the data contained in this website.
Fusion Media may be compensated by the advertisers that appear on the website, based on your interaction with the advertisements or advertisers.
© 2007-2024 - Fusion Media Limited. All Rights Reserved.