Forex News and Events
As the global economic slowdown story gains traction, the spillover into oil prices has been acute. Since WTI crude’s 2014 peak at $104, the price has fallen over 22% ($24 decline), a four-month downtrend. The decline was amplified by an overabundance of supply hitting the market and an inability of struggling Asian economies to absorb the surplus. Brent Oil has followed a similar pattern of weakness slipping below $85 - the lowest level since 2010. Commodity correlated currencies such as the CAD, RUB and NOK have been hit hardest by the lower oil prices. Overnight, global energy markets were provided more oil negative news. The IEA revised lower its demand projections by 250 barrels per day, citing easing slowing global economies. The cut forecast sent oil prices further down, the WTI crude hit $80.40 in the European session today. On a final note regarding the direction of oil prices (risk of further downside), traders are eyeing OPEC’s next meeting on November 27th. In normal circumstance, we should expect OPEC to react but due to geopolitical issues we believe OPEC will allow further weakness oil prices.
BoC-doves in charge
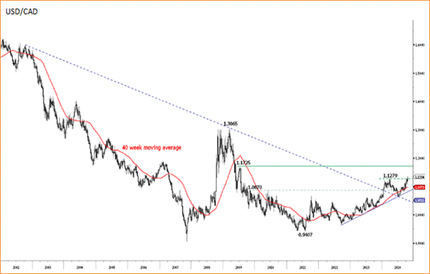
USD/CAD extend gains to the fresh 5-year high of 1.1375 due to concerns on falling oil prices. The oil prices are now at alarming levels, as the oil industry will get a serious hit below the $85-profitability-threshold for some oil sand projects, according to International Energy Agency. If this is the case, lower prices can only hit Canada’s most important export business and thus impact the already fragile Canadian recovery. Autumn Business Outlook Survey showed signs of firmer foreign demand, yet the slight improvement in business outlook failed to strengthen investment intensions for the next 12 months (source: BoC website). The trend in oil prices will perhaps not be helpful to push investor appetite higher.
Technically, the USD/CAD extension over the 1.1280 resistance suggests the bullish momentum remains on track, with a medium target of 1.15. Although in the longer run yield spreads have a greater influence. The divergence between BoC and Fed policy further support the upside in USD/CAD. In addition, the 3-month currency basis print significant preference for USD vs. CAD. The BoC should remain dovish as long as the macroeconomic conditions (especially the inflation) allow supporting export growth through currency depreciation. This should let the USD/CAD short term spreads to further widen, pushing USD/CAD higher. In a similar fashion, EUR/CAD rallies to 1.43979 for the first time since September 15th. The bullish trend strengthens suggesting the extension of gains towards the 200-dma (1.48s) despite the fundamental EUR weakness.
Canada CPI due on Friday
This Friday, Canada publishes September CPI data. Markets expect slight cool-off in Canadian consumer prices (from 2.1% y/y to 2.0% y/y for the headline CPI) as the current CPI levels are mostly believed to be temporary (especially according to the BoC). Softer inflation will give flexibility to BoC Poloz to stay accomodative. We do not expect any rate action on October 22nd policy meeting.

Today's Key Issues (time in GMT)
2014-10-15T09:00:00 USD Oct 10th MBA Mortgage Applications, last 3.80%
2014-10-15T10:30:00 USD Oct Empire Manufacturing, exp 20.7, last 27.54
2014-10-15T10:30:00 USD Sep Retail Sales Advance MoM, exp -0.20%, last 0.60%
2014-10-15T10:30:00 USD Sep Retail Sales Ex Auto MoM, exp 0.20%, last 0.30%
2014-10-15T10:30:00 USD Sep Retail Sales Ex Auto and Gas, exp 0.40%, last 0.50%
2014-10-15T10:30:00 USD Sep Retail Sales Control Group, exp 0.40%, last 0.40%
2014-10-15T10:30:00 USD Sep PPI Final Demand MoM, exp 0.10%, last 0.00%
2014-10-15T10:30:00 USD Sep PPI Ex Food and Energy MoM, exp 0.10%, last 0.10%
2014-10-15T10:30:00 USD Sep PPI Final Demand YoY, exp 1.80%, last 1.80%
2014-10-15T10:30:00 USD Sep PPI Ex Food and Energy YoY, exp 1.70%, last 1.80%
2014-10-15T11:00:00 CAD Sep Existing Home Sales MoM, last 1.80%
2014-10-15T11:00:00 CAD Sep Teranet/National Bank HPI MoM, last 0.80%
2014-10-15T11:00:00 CAD Sep Teranet/National Bank HPI YoY, last 5.00%
2014-10-15T11:00:00 CAD Sep Teranet/National Bank HP Index, last 167.12
2014-10-15T12:00:00 USD Aug Business Inventories, exp 0.40%, last 0.40%
2014-10-15T13:00:00 USD Sep Monthly Budget Statement, exp $90.0B, last $75.1B
2014-10-15T16:00:00 USD U.S. Federal Reserve Releases Beige Book
The Risk Today
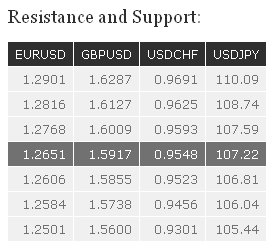
EUR/USD EUR/USD has thus far failed to make any higher high. However, no lower low has been made either. Hourly resistances stand at 1.2768 (14/10/2014 high) and 1.2816. An hourly support can be found at 1.2606 (10/10/2014 low). A key support now lies at 1.2501. In the longer term, EUR/USD is in a succession of lower highs and lower lows since May 2014. The break of the strong support area between 1.2755 (09/07/2013 low) and 1.2662 (13/11/2012 low) opens the way for a decline towards the strong support at 1.2043 (24/07/2012 low). Intermediate supports are given by 1.2500 (psychological support) and 1.2466 (28/08/2012 low).
GBP/USD GBP/USD continues to decline, as can be seen by the break of the support at 1.5944 (06/10/2014 low). Prices are now challenging the key support at 1.5855. Hourly resistances for a short-term bounce can be found at 1.6009 (10/10/2014 low) and 1.6127 (13/10/2014 high). In the longer term, the collapse in prices after having reached 4-year highs has created a strong resistance at 1.7192, which is unlikely to be broken in the coming months. Despite the recent short-term bearish momentum, we favour a temporary rebound near the support at 1.5855 (12/11/2013 low). A resistance lies at 1.6525. The break of the support at 1.5944 has invalidated our long position.
USD/JPY USD/JPY has thus far successfully tested the support at 106.81 (see also the 38.2% retracement). A break of the hourly resistance at 107.59 would improve the short-term technical structure. Another resistance stands at 108.74, whereas another support lies at 106.04. A long-term bullish bias is favoured as long as the key support 100.76 (04/02/2014 low) holds. Despite a probable medium-term consolidation phase after the successful test of the major resistance at 110.66 (15/08/2008 high, see also the 50% retracement from the 1998's top), a gradual move higher is eventually favoured. Another resistance can be found at 114.66 (27/12/2007 high).
USD/CHF USD/CHF has thus far successfully tested its recent low at 0.9469. The hourly resistance at 0.9552 (intraday high, see also the declining trendline) is challenged. A break of the resistance at 0.9593 (10/10/2014 high) would validate a short-term double-bottom. An initial support can be found at 0.9523 (intraday low). From a longer term perspective, the technical structure favours a full retracement of the large corrective phase that started in July 2012. As a result, the recent weakness is seen as a countertrend move. A key support can be found at 0.9301 (16/09/2014 low). A resistance now lies at 0.9691 (06/10/2014 high).

