Get 40% Off
👀 👁 🧿 All eyes on Biogen, up +4,56% after posting earnings. Our AI picked it in March 2024.
Which stocks will surge next?
Unlock AI-picked Stocks

Look For Technology Leadership First

Published 08/16/2014, 11:29 PM
Updated 07/09/2023, 06:31 AM

A continued rally in the equity markets is really dependent on continued leadership in Technology, as well as a recovery in Small-Caps.

The following Weekly comparison chart of the Dow 30, S&P 500Nasdaq 100 and Russell 2000 Indices shows that, from the 2009 lows, Technology has led the overall rally, for the most part, and, particularly, since early this year when the spread has widened considerably between the NDX and the others.
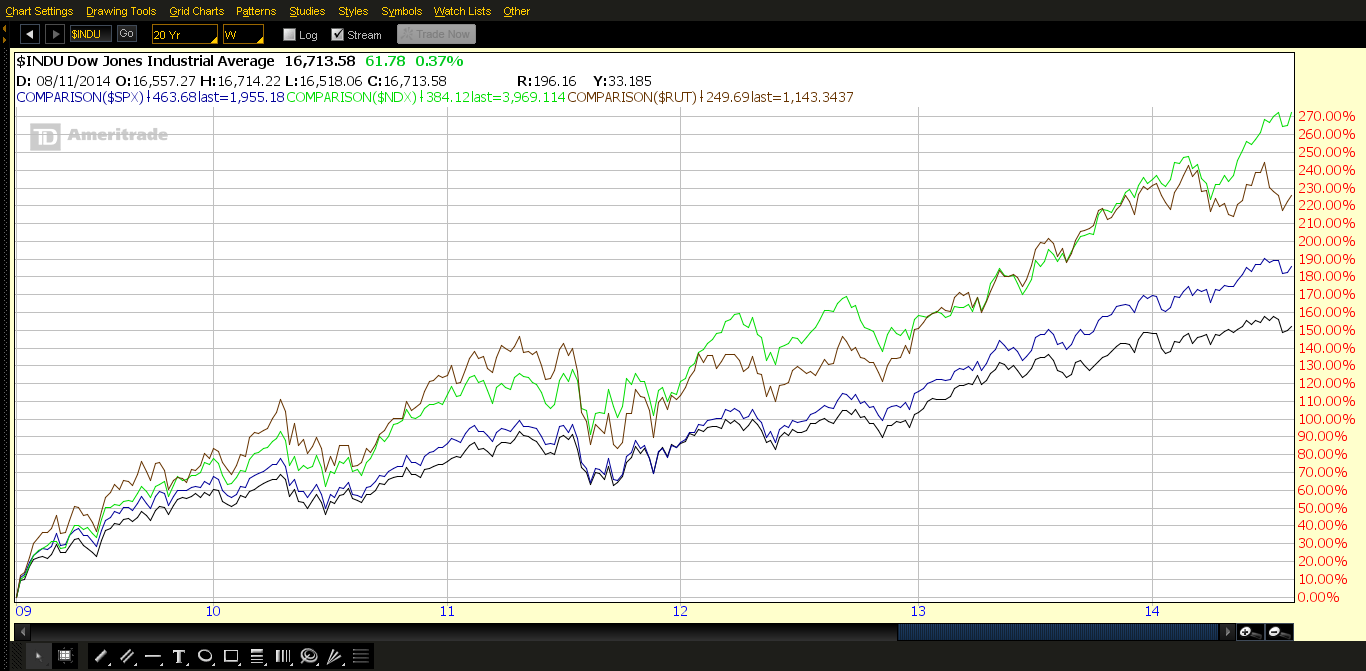
INDU Daily (August 11, 2014)


The following 60-day 60-minute comparison chart of these 4 Indices shows the NDX approaching this year's high, while the RUT has the furthest to go to reach that point. I'd watch for any build in volumes in the NDX and the RUT on, either a rally, or any decline from this point...to confirm a commitment in sentiment, one way or the other.
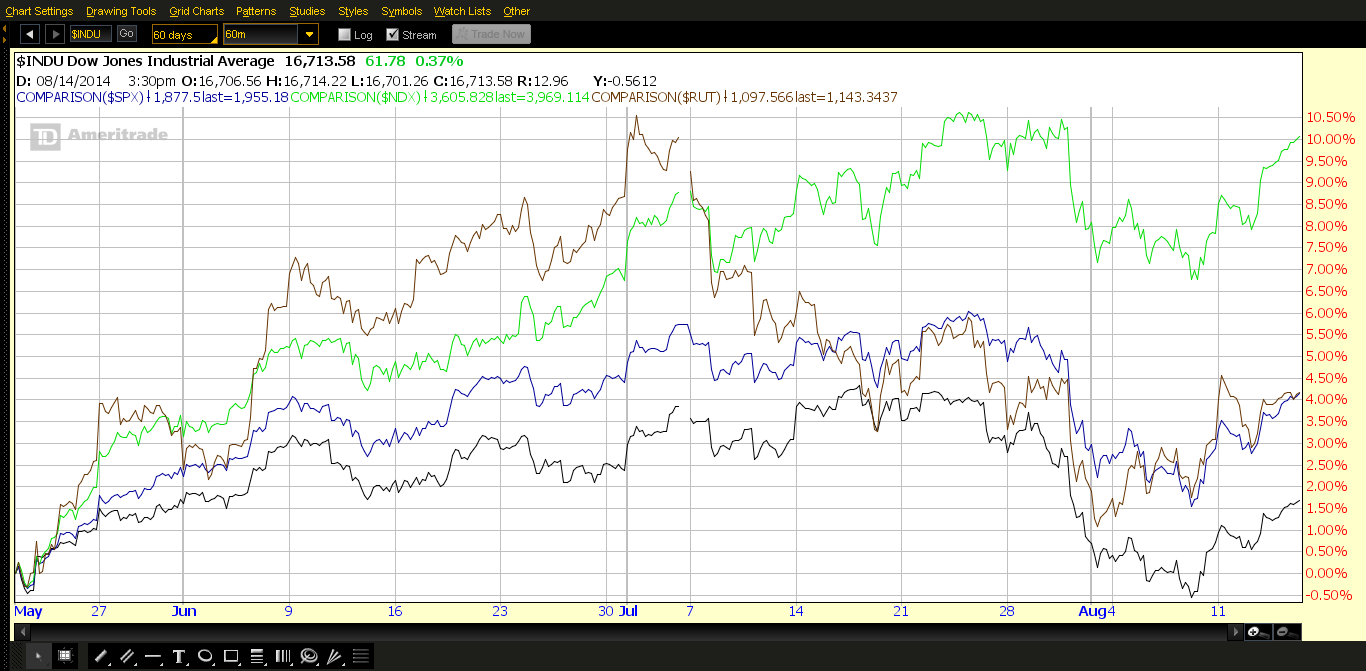
INDU Daily (August 14, 2014)


The declining momentum indicator on the following 60-day 60-minute ratio chart of SPX:VIX is not confirming this latest rally in the SPX from August 11th.

Any low-volume push higher in the NDX and RUT, combined with weakness in the SPX may indicate a loss of appetite for equities in the near-term. Price on this ratio chart has pushed above the near-term resistance level of 150.00 (mentioned in my post of August 11th). Failure to hold this level will likely see Monday's gap-up filled. A break and hold below the 110.00 level may see a much larger-scale correction in equities begin...hence, the importance of volume commitment, either way, in the NDX and RUT.
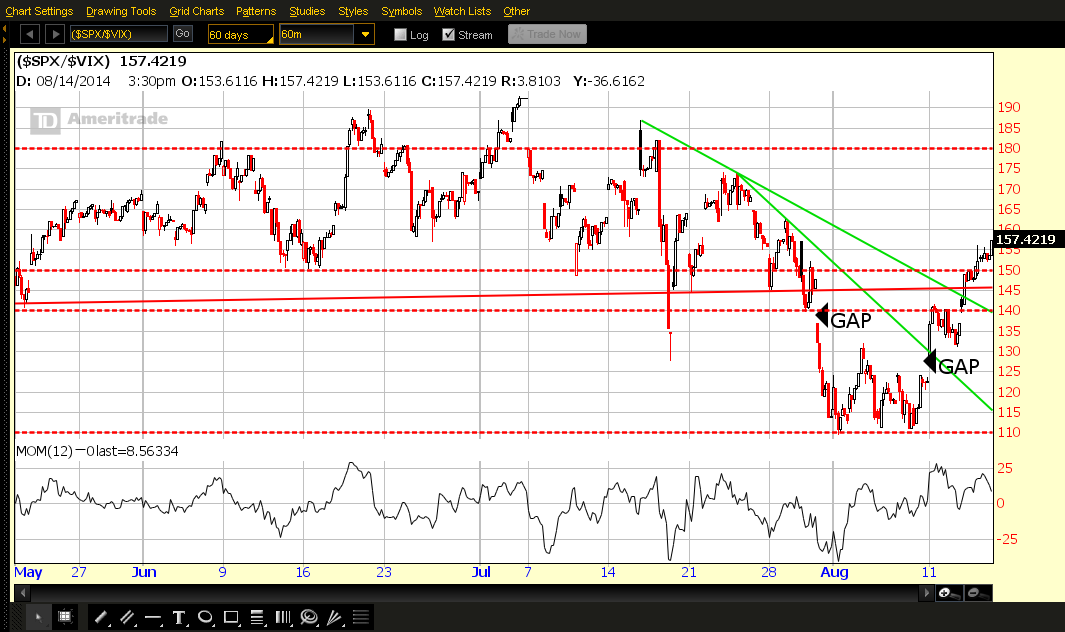
SPX vs VIX Daily

Latest comments

Risk Disclosure: Trading in financial instruments and/or cryptocurrencies involves high risks including the risk of losing some, or all, of your investment amount, and may not be suitable for all investors. Prices of cryptocurrencies are extremely volatile and may be affected by external factors such as financial, regulatory or political events. Trading on margin increases the financial risks.
Before deciding to trade in financial instrument or cryptocurrencies you should be fully informed of the risks and costs associated with trading the financial markets, carefully consider your investment objectives, level of experience, and risk appetite, and seek professional advice where needed.
Fusion Media would like to remind you that the data contained in this website is not necessarily real-time nor accurate. The data and prices on the website are not necessarily provided by any market or exchange, but may be provided by market makers, and so prices may not be accurate and may differ from the actual price at any given market, meaning prices are indicative and not appropriate for trading purposes. Fusion Media and any provider of the data contained in this website will not accept liability for any loss or damage as a result of your trading, or your reliance on the information contained within this website.
It is prohibited to use, store, reproduce, display, modify, transmit or distribute the data contained in this website without the explicit prior written permission of Fusion Media and/or the data provider. All intellectual property rights are reserved by the providers and/or the exchange providing the data contained in this website.
Fusion Media may be compensated by the advertisers that appear on the website, based on your interaction with the advertisements or advertisers.
© 2007-2024 - Fusion Media Limited. All Rights Reserved.