Get 40% Off
👀 👁 🧿 All eyes on Biogen, up +4,56% after posting earnings. Our AI picked it in March 2024.
Which stocks will surge next?
Unlock AI-picked Stocks

Long-Term Treasuries, Precious Metals Outperform Equities

Published 07/20/2014, 12:20 AM
Updated 07/09/2023, 06:31 AM

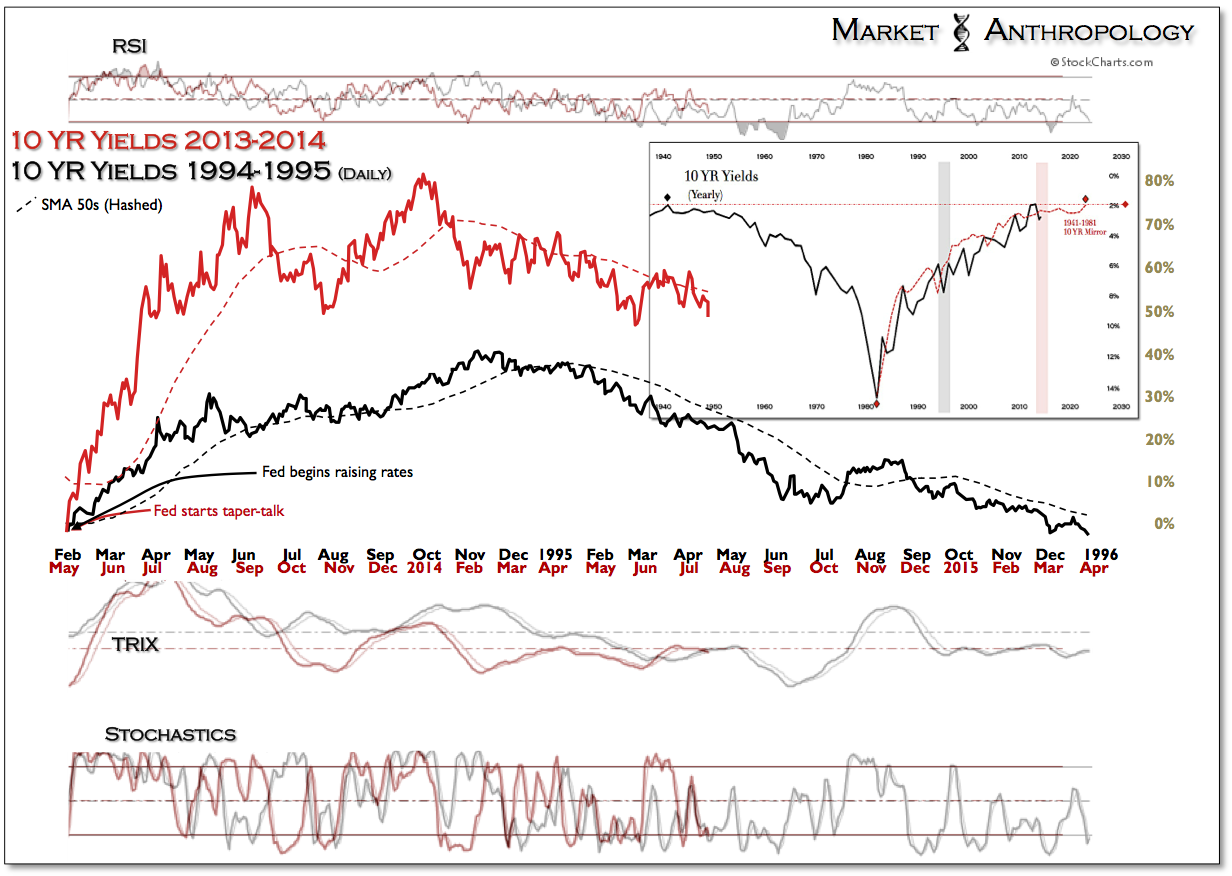
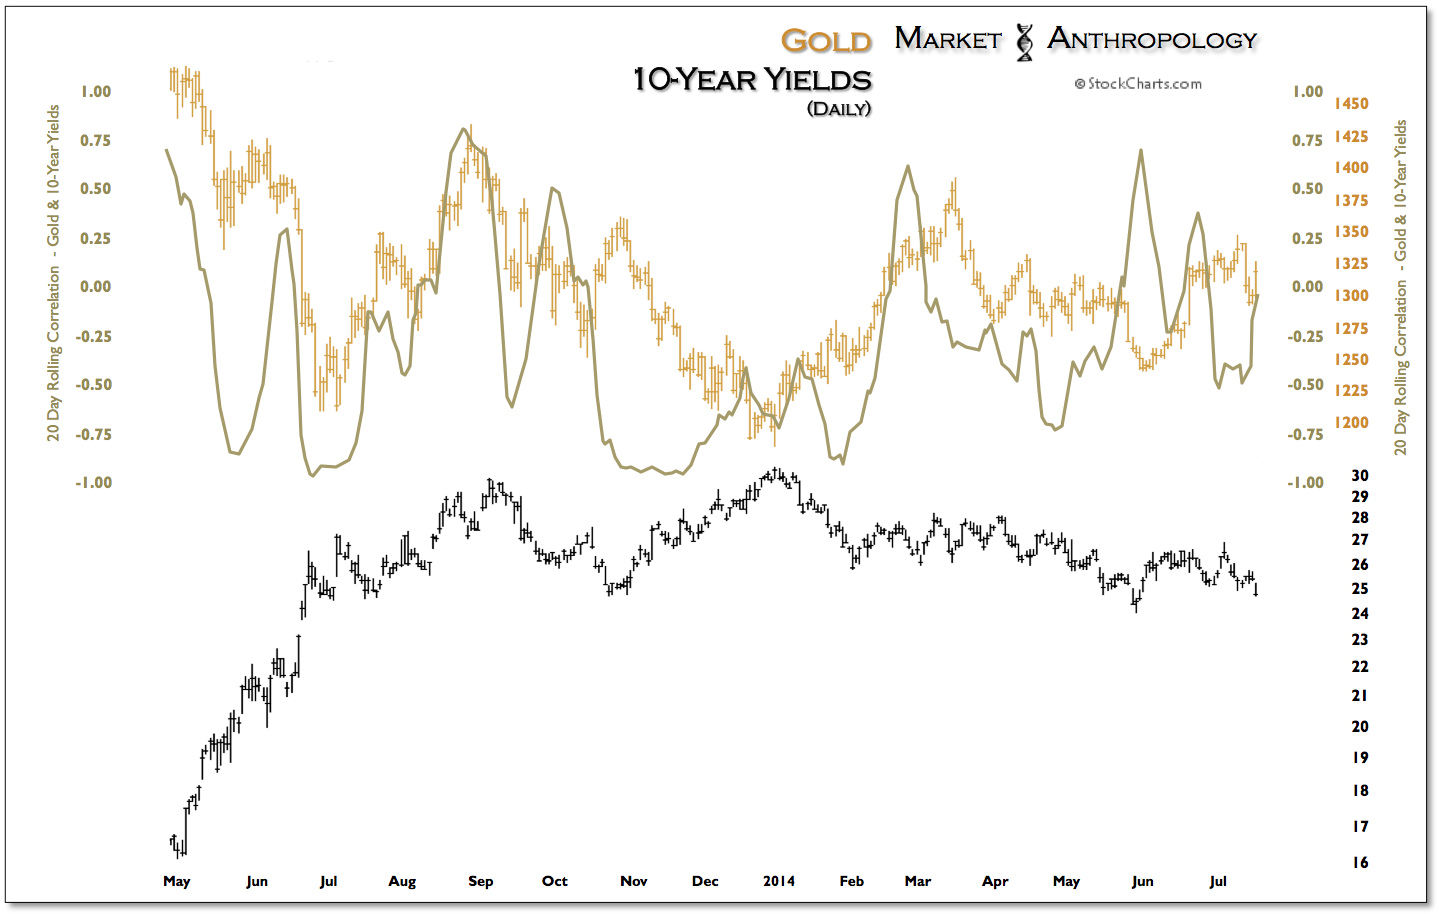
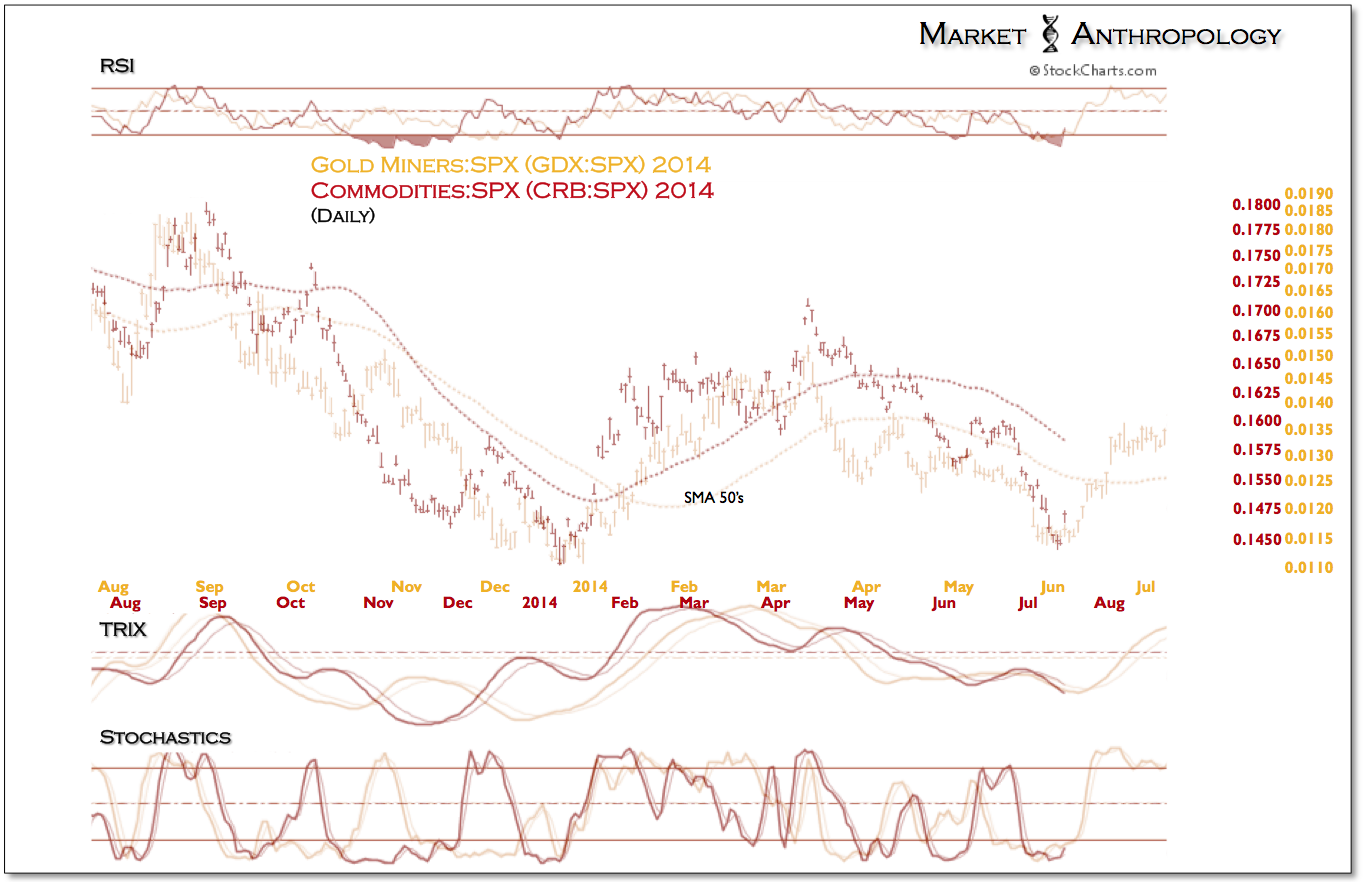
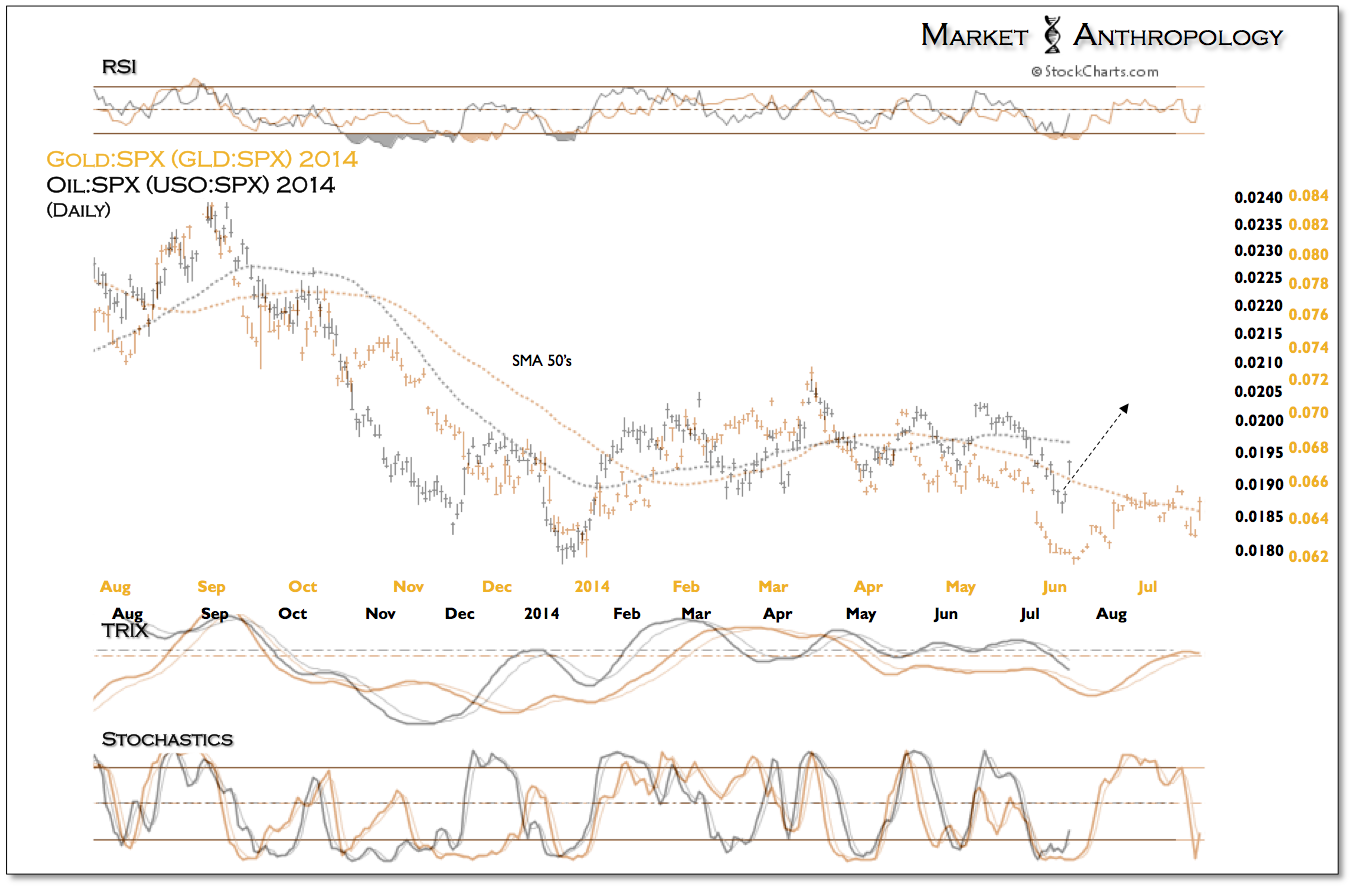
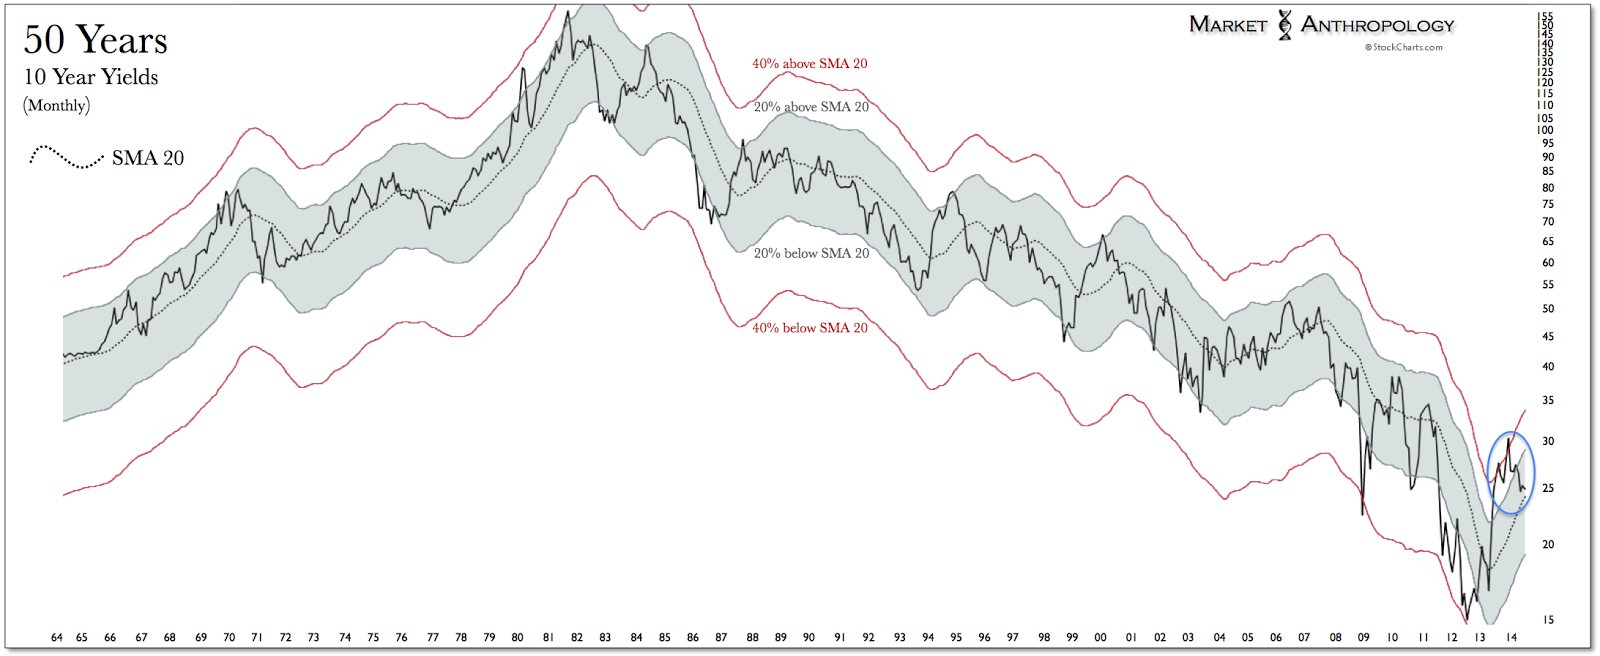
U.S. 10-Year yields continue to drip lower, reacting to the recent and heart-wrenching geopolitical tragedies that appear to flame a growing instability behind a benevolent market environment. And while the latest turn of events has provided further motivation for participants' reflexive appetites toward certain safe-haven corners of the market, these respective asset trends have been in place all year. Long-term Treasuries and precious metals continue to outperform equities, while the broader commodity sector has recently retraced back to commensurate returns with the SPX this year. 

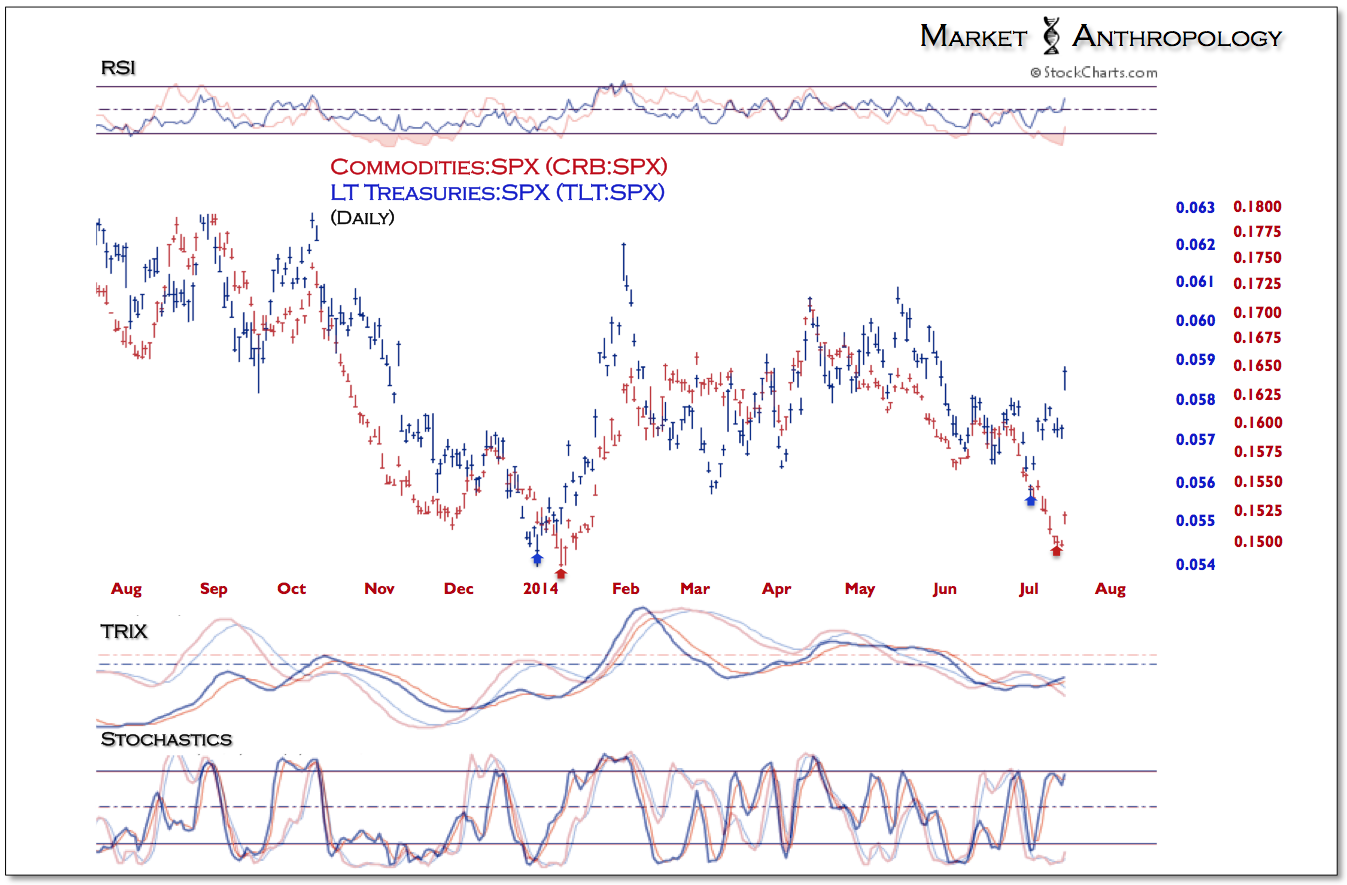
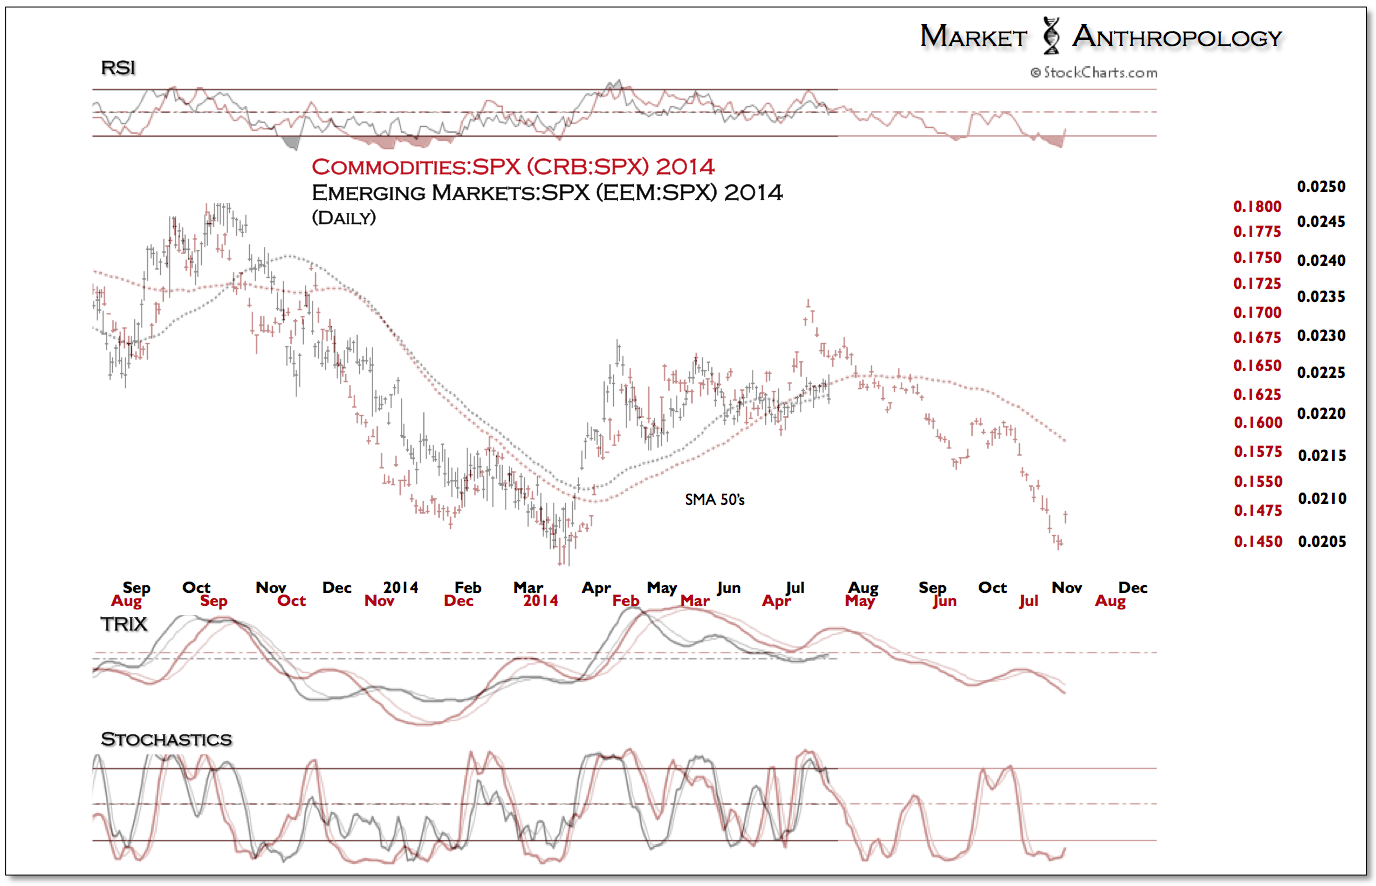
As we highlighted in last week's notes (here and here), long-term Treasuries and commodities were following in the month old footprints of the precious metals sector. Filling out the proportion of the pattern, both asset classes have pivoted higher over the past week after testing the lows (relative to the SPX) from earlier in the year. Long-term Treasuries have been leading the move higher over the past two weeks and we anticipate that the broader commodity space will be pulled up in its wake going forward. Following the lagged blueprint of the study, emerging market equities look susceptible over the coming weeks to retracement declines relative to the SPX. 

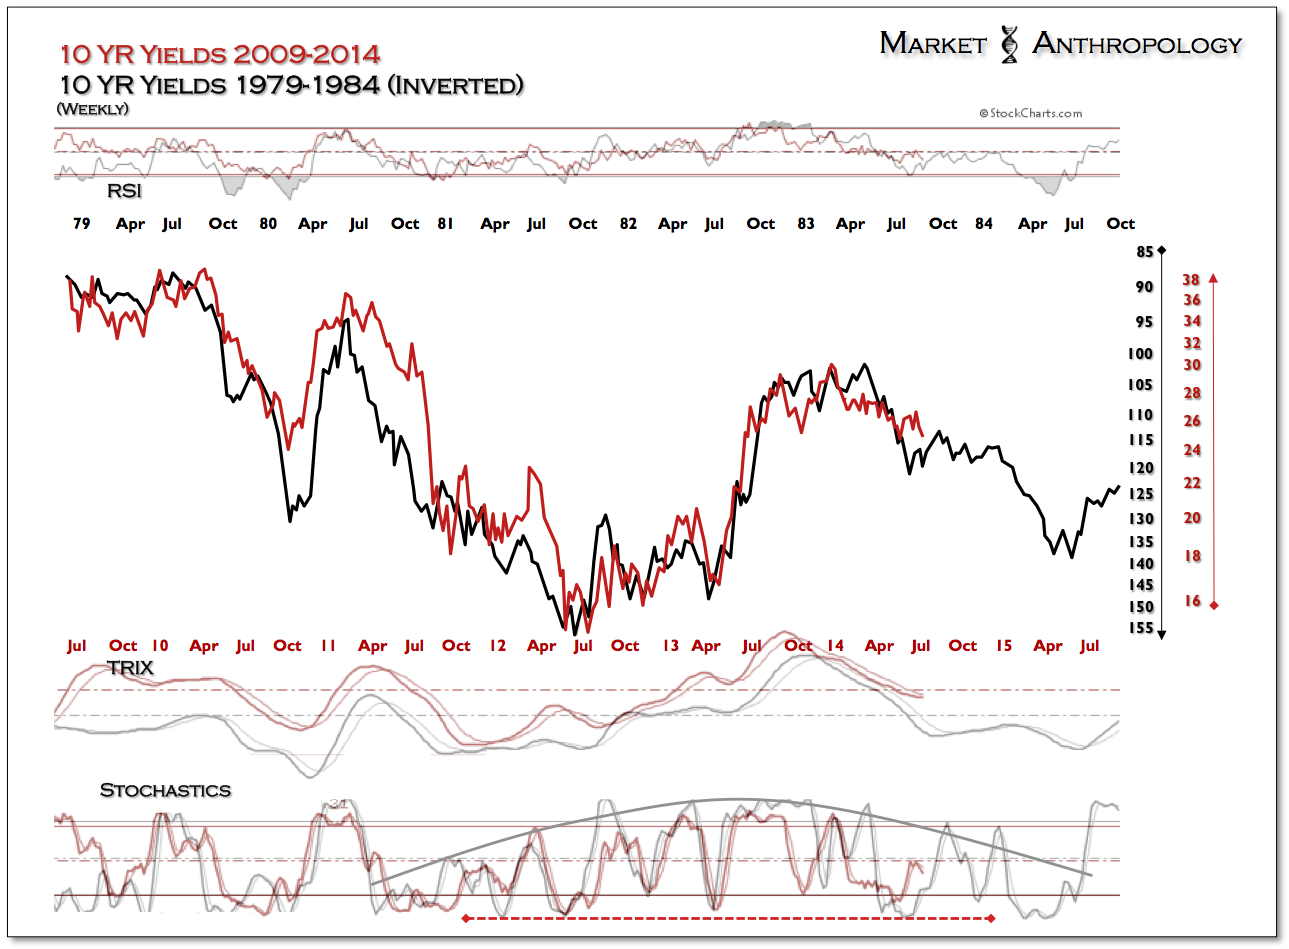
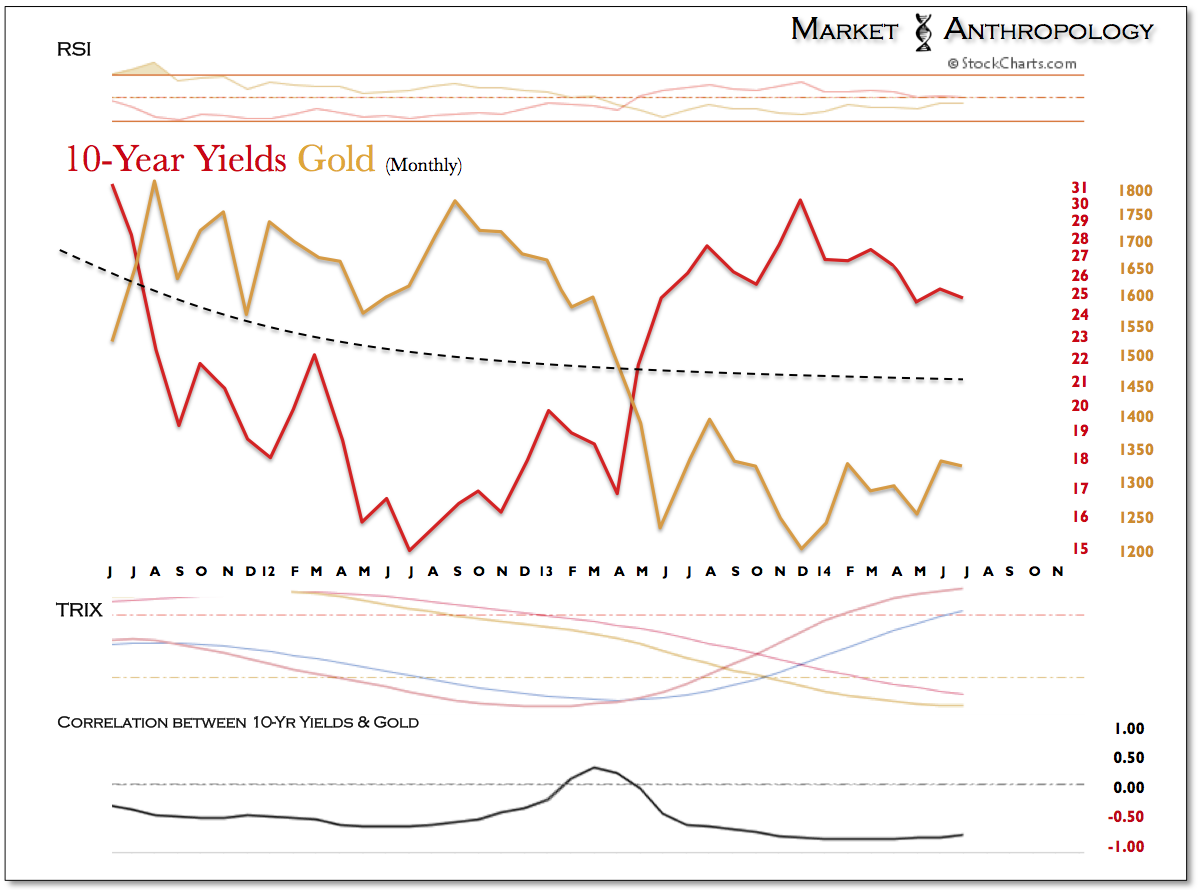
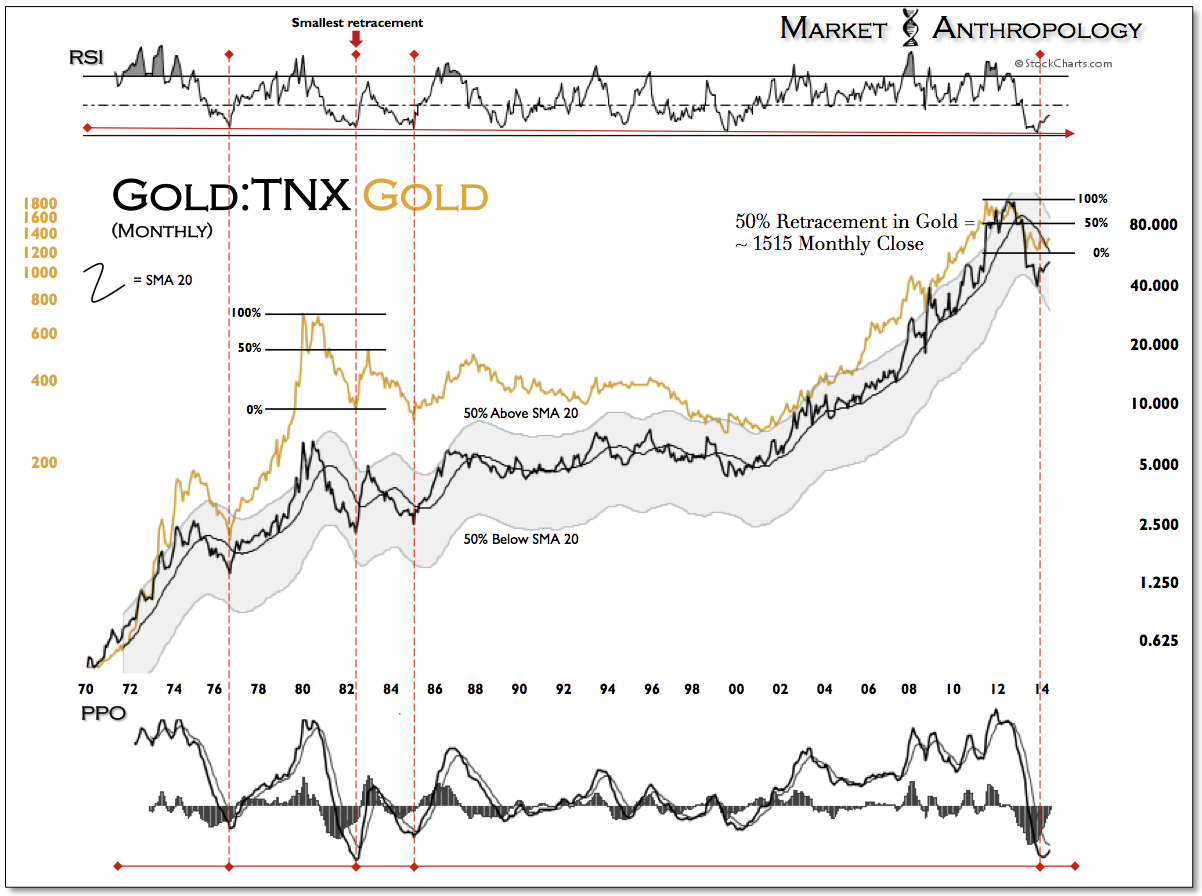
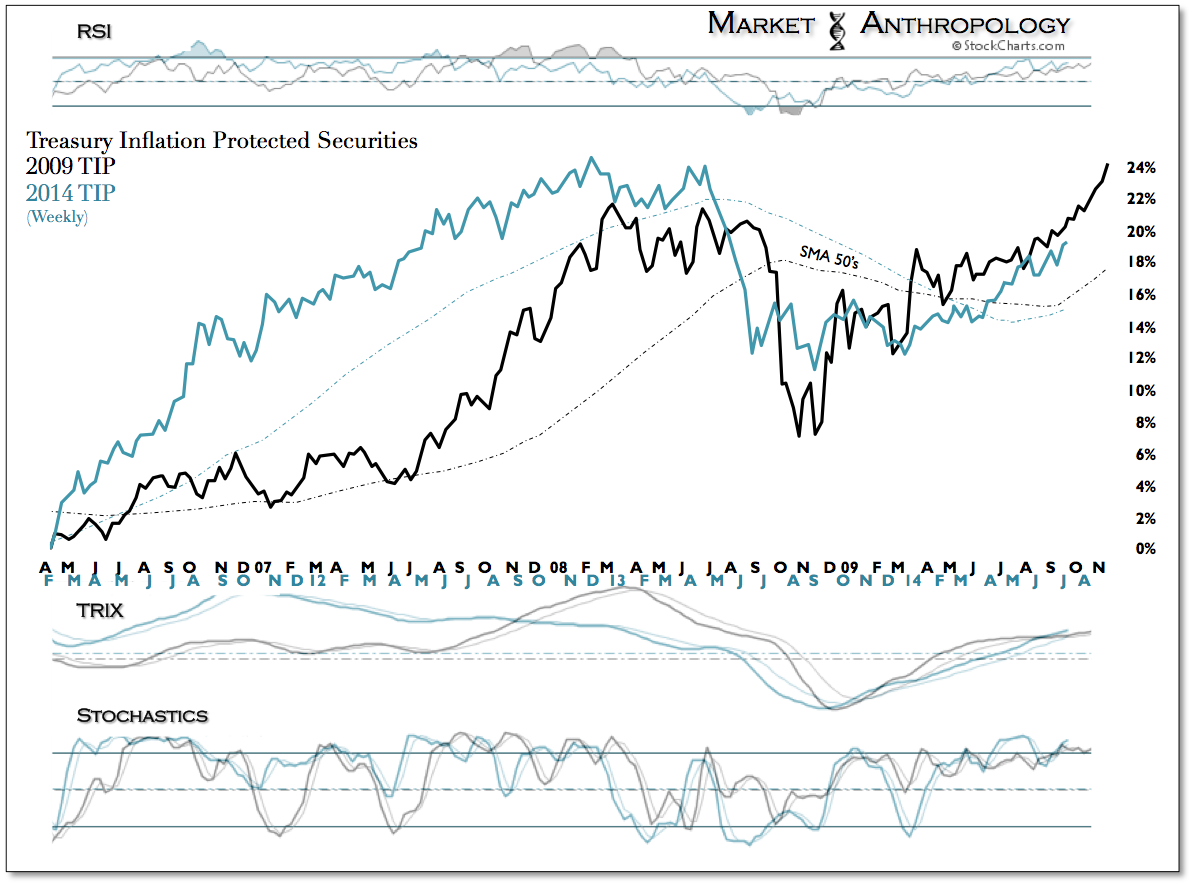
The precious metals sector retraced sharply lower over the past week, turning down for the first time since the explosive rally out of the June 2nd lows. Relieving strongly overbought conditions while the currency markets complete their retracement obligations, we remain firmly bullish towards the sector's prospects in the balance of the year. Our comparative studies of the US dollar, the euro and 10-year yields all point towards favorable backdrop conditions, as real yields walk lower - encouraging the developing trends in long-term Treasuries and commodities. The TIP study that we have highlighted throughout the year continues to make its way towards another leap higher in the range that we anticipate will be made in the second half of summer.    

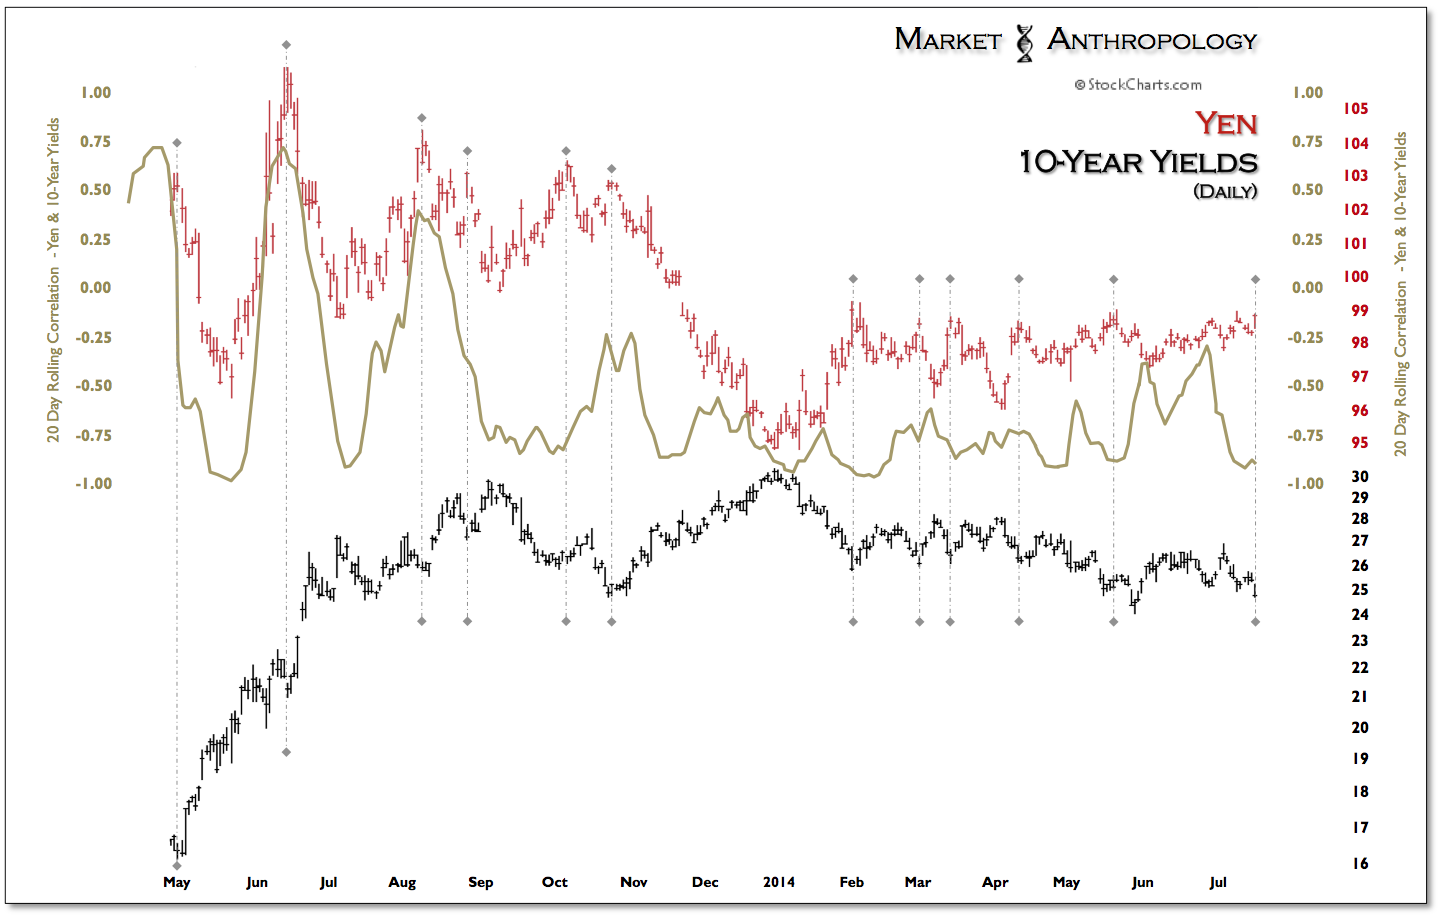
As 10-year yields work towards another breakdown below the late May lows, we expect the yen will finally break higher out of the flagging range it has traded in throughout this year. All things considered, this is buttressed by our comparative expectations that the Nikkei will make another retracement move down - before finally making a break higher above long-term resistance this fall. 
3rd party Ad. Not an offer or recommendation by Investing.com. See disclosure here or remove ads .
50 Years of 10-Y Yields
10-Y Yields Daily: 2013-2014 vs 1994-1995
10-Y Yields Weekly: 2009-2014 vs 1979-1984 (Inverted)
10-Y Yields vs Gold Monthly
Gold:TNX Monthly

GLD vs 10-Y Yields Daily
Yen vs 10-Y Yields DailyTIPs 2009 vs 2014 Weekly
CRB:SPX vs TLT:SPX Daily
GDX:SPX 2014 vs CRB:SPX 2014 Daily

GLD:SPX vs USO:SPX 2014 Daily
CRB:SPX vs EEMSPX 2014

Latest comments

Risk Disclosure: Trading in financial instruments and/or cryptocurrencies involves high risks including the risk of losing some, or all, of your investment amount, and may not be suitable for all investors. Prices of cryptocurrencies are extremely volatile and may be affected by external factors such as financial, regulatory or political events. Trading on margin increases the financial risks.
Before deciding to trade in financial instrument or cryptocurrencies you should be fully informed of the risks and costs associated with trading the financial markets, carefully consider your investment objectives, level of experience, and risk appetite, and seek professional advice where needed.
Fusion Media would like to remind you that the data contained in this website is not necessarily real-time nor accurate. The data and prices on the website are not necessarily provided by any market or exchange, but may be provided by market makers, and so prices may not be accurate and may differ from the actual price at any given market, meaning prices are indicative and not appropriate for trading purposes. Fusion Media and any provider of the data contained in this website will not accept liability for any loss or damage as a result of your trading, or your reliance on the information contained within this website.
It is prohibited to use, store, reproduce, display, modify, transmit or distribute the data contained in this website without the explicit prior written permission of Fusion Media and/or the data provider. All intellectual property rights are reserved by the providers and/or the exchange providing the data contained in this website.
Fusion Media may be compensated by the advertisers that appear on the website, based on your interaction with the advertisements or advertisers.
© 2007-2024 - Fusion Media Limited. All Rights Reserved.