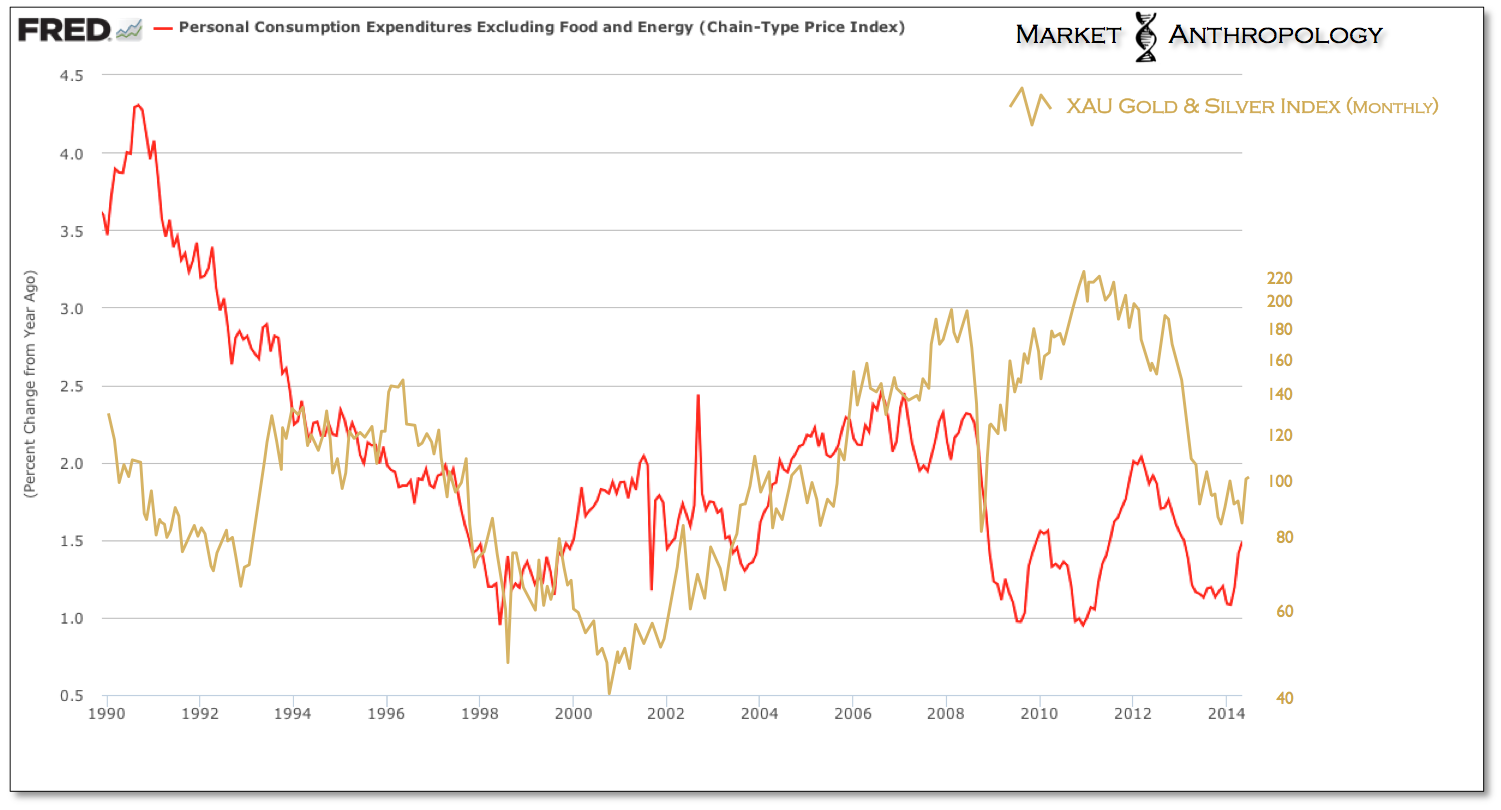
Over the years we've gravitated towards tracking the nuances in the precious metals sector, because they can be great leading indicators of some of the broader changes in the macro climate.
- In 2011, we kept a close eye on silver and the silver:gold ratio, as it shot up its parabolic peak and exhausted in the indiscriminate risk blow-off that culminated at the end of April of that year.
- In 2012, we followed the sector lower as it made a tradable low at the end of Q2, but warned of the comparative differences between QE II and QE III that participants were drawing with the precious metals and commodity markets.
- At the start of 2013, we made the comparison to the value traps of the previous cycle, as their respective miners were leading spot prices and inflation expectations to an eventual capitulation in the sector and the data.
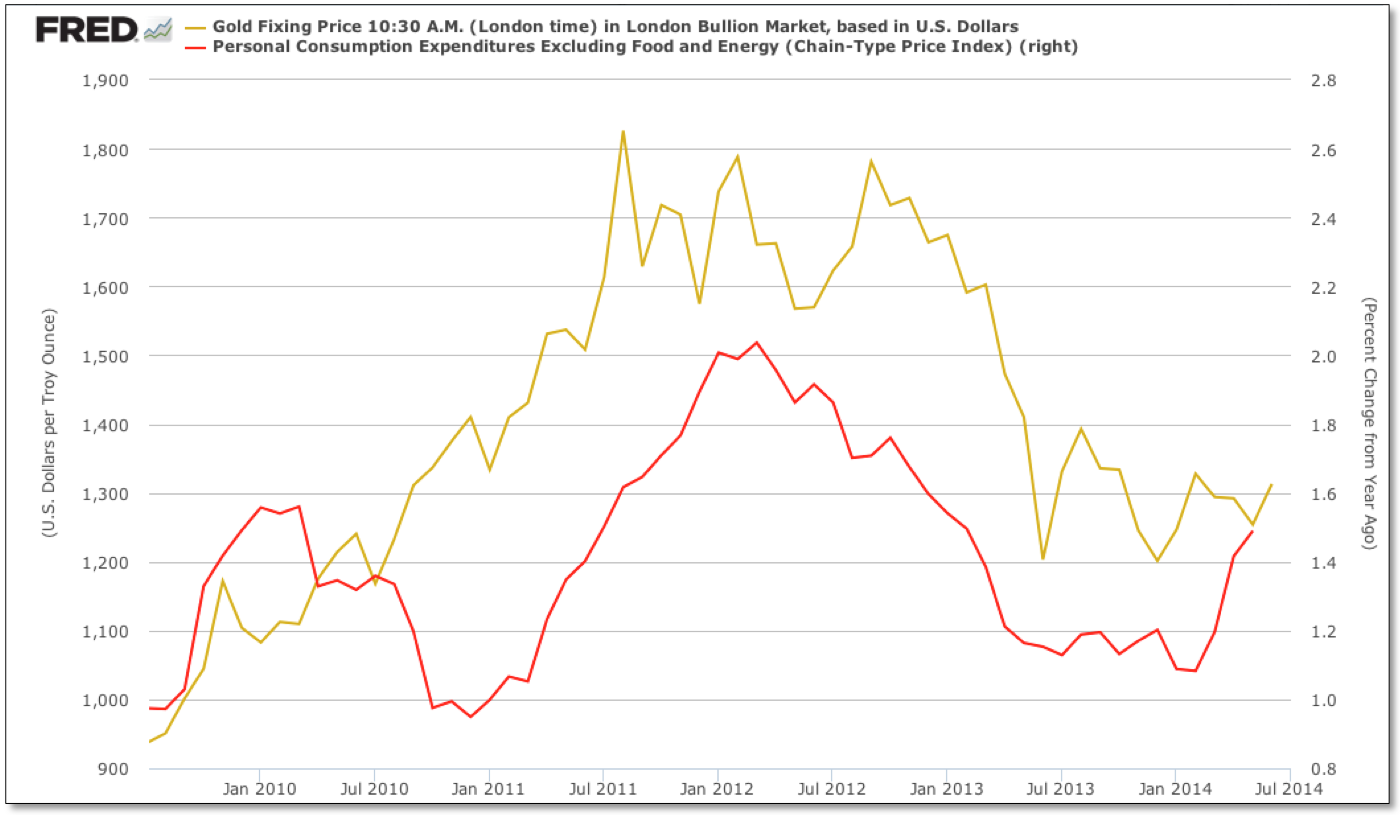
Today, we continue to closely monitor and weigh the precious metals sector as it forges the leading path higher for the broader commodity space and corners of the market that are tangentially influenced with their respective performance and growth trends. Not surprisingly, the pivot higher in precious metals has also been marked with a trend shift north in the inflation data this year.
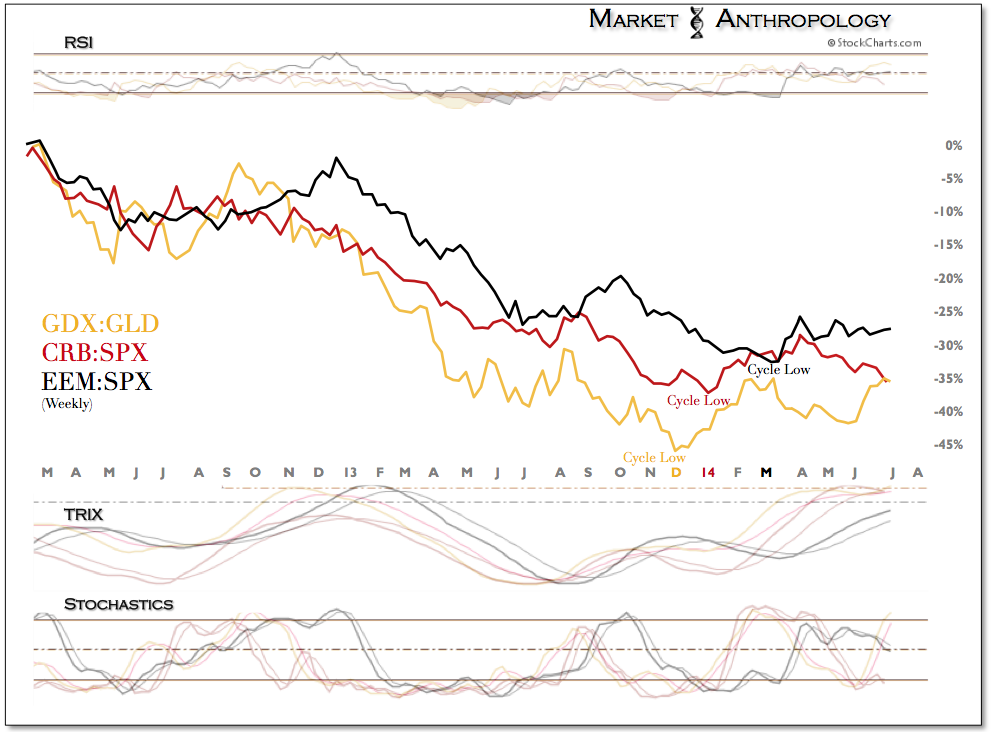
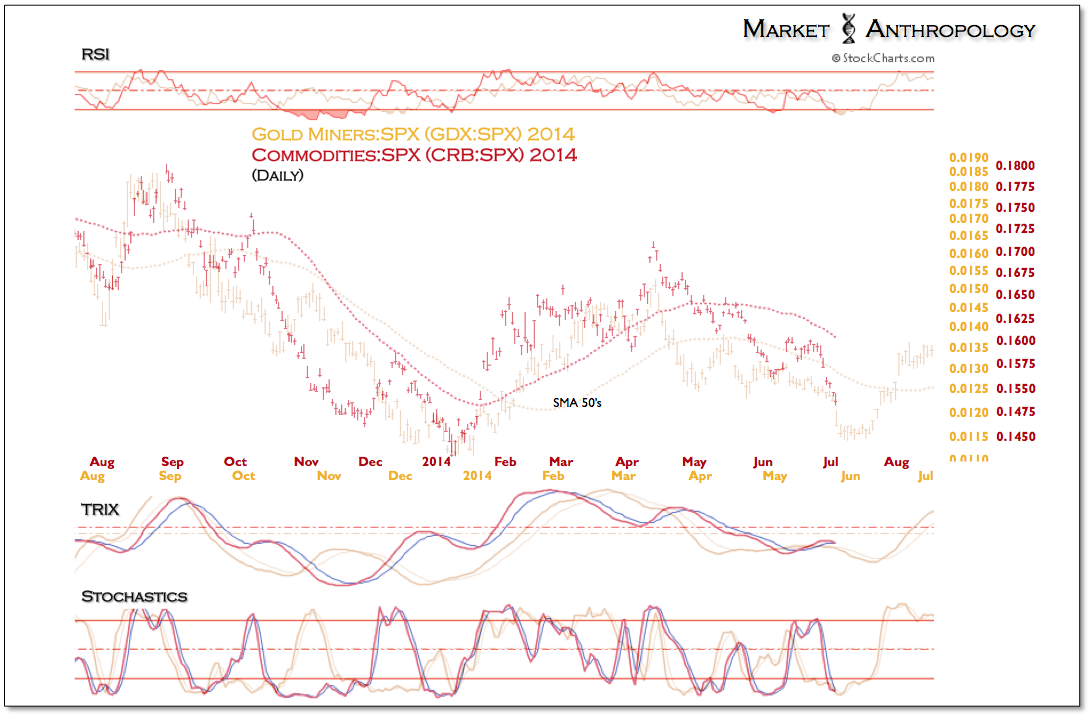
Throughout the year we have followed three risk ratio proxies that have illustrated the staggered start that has developed in the markets as the inflation vane has begun blowing steadily out of the south. Leading the way, the precious metals miners - relative to both spot prices and the S&P 500, made a cyclical low in December of last year and tested those lows coming into June. Similar to the move in silver, the subsequent rally in the miners has been explosive from their respective support zones.
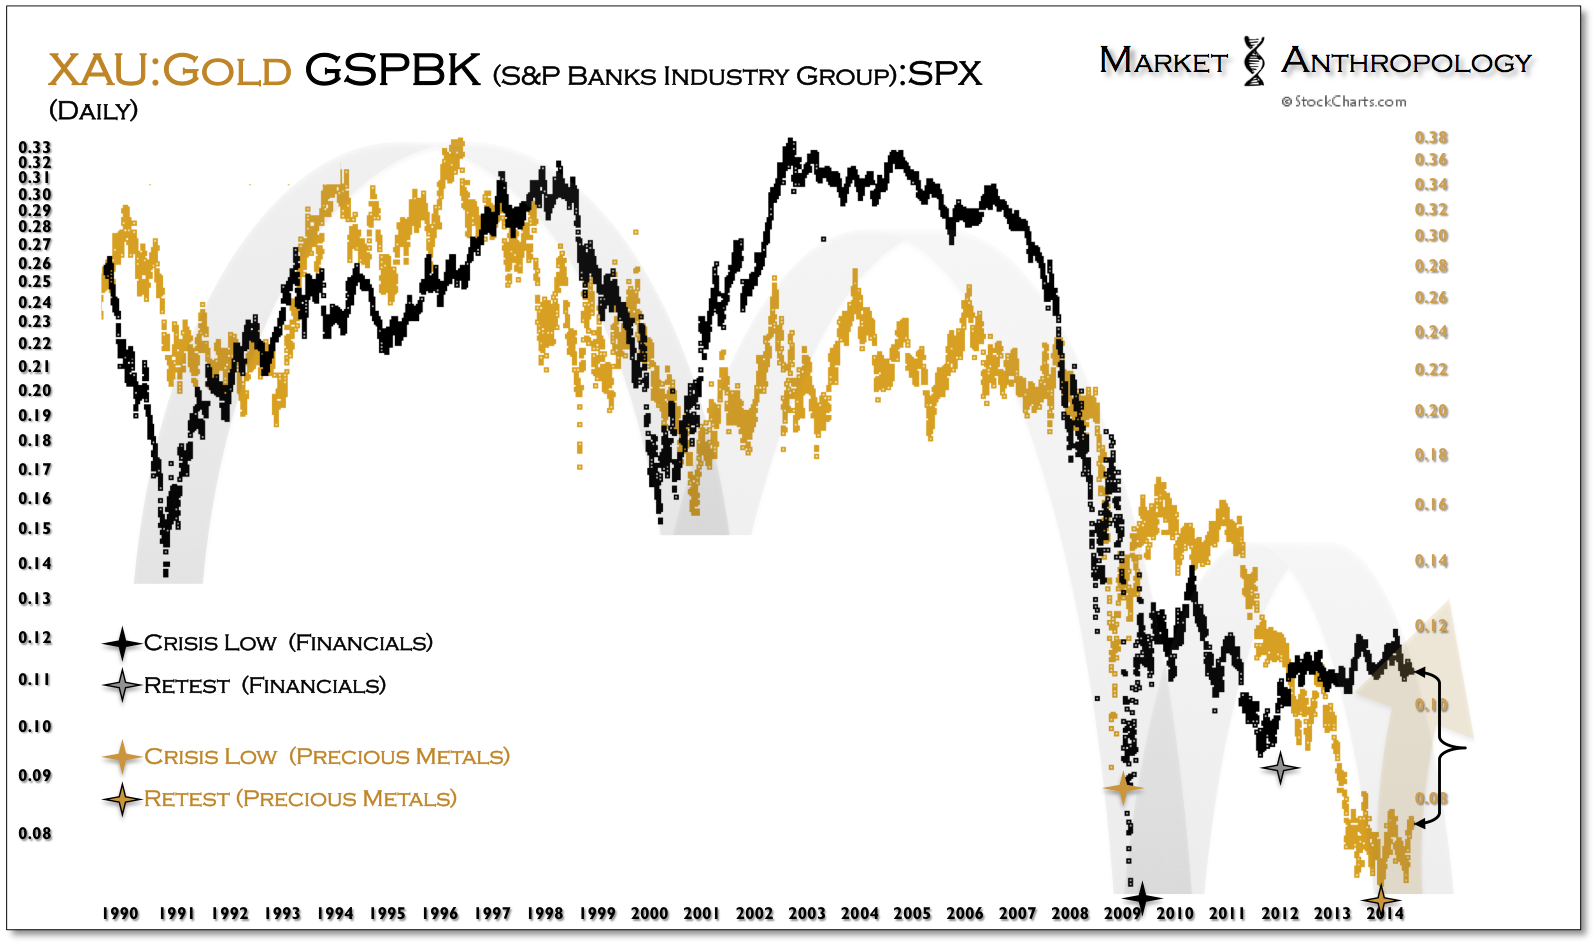
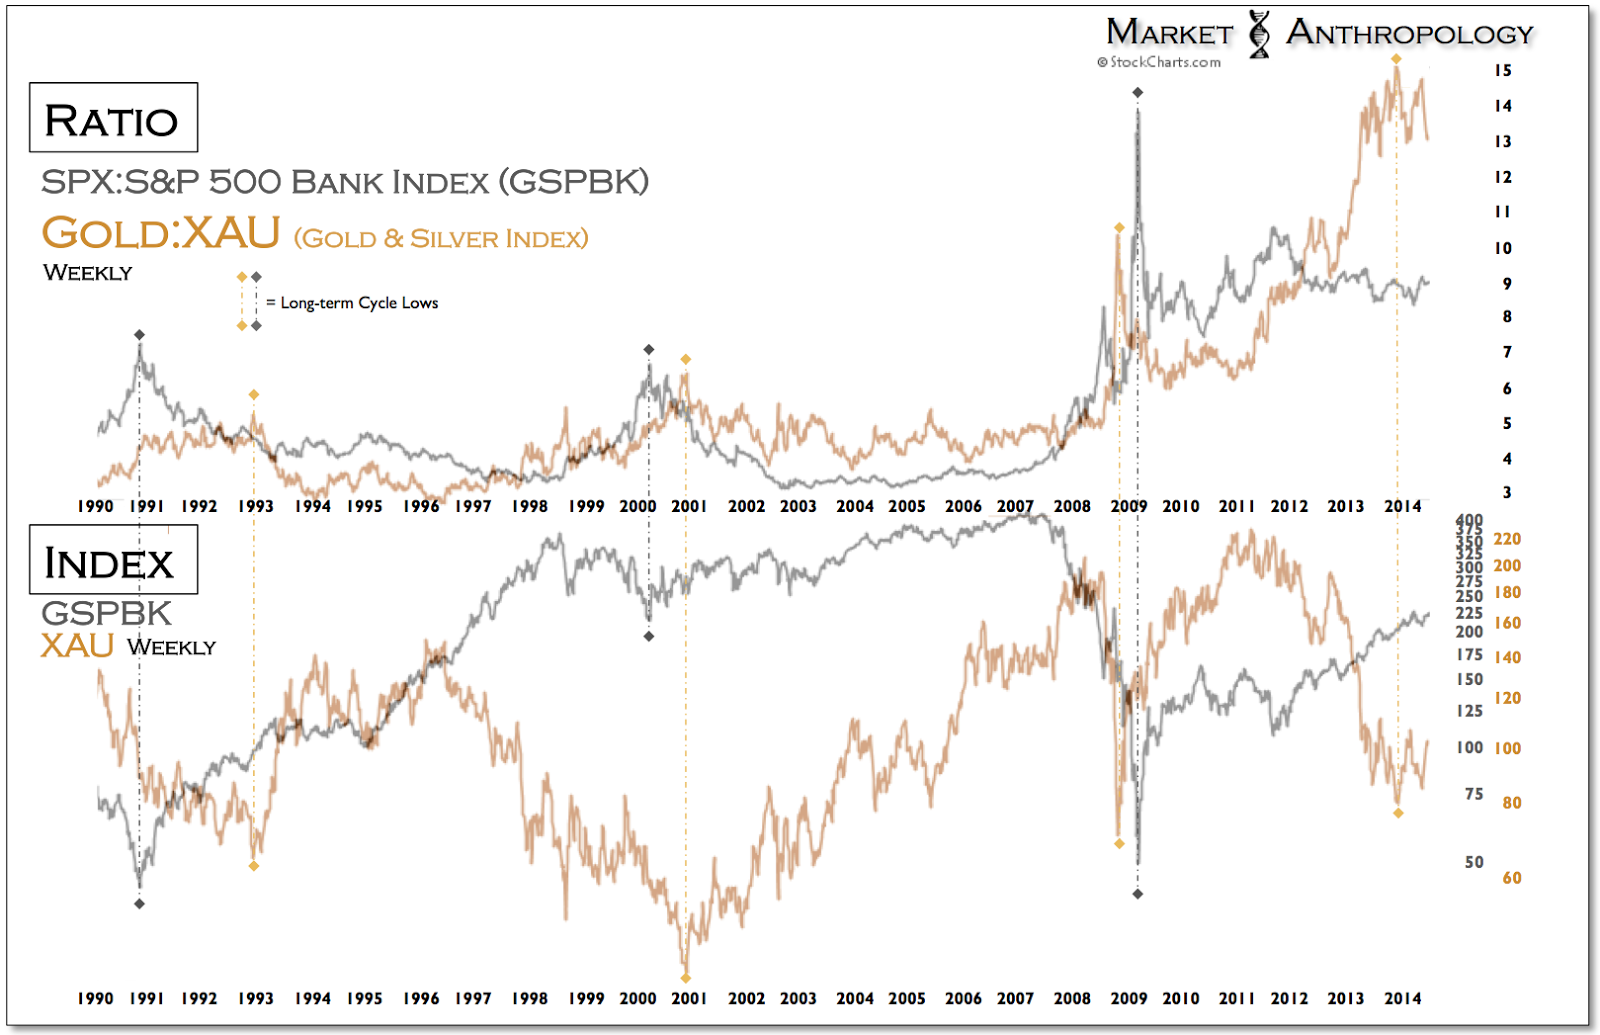
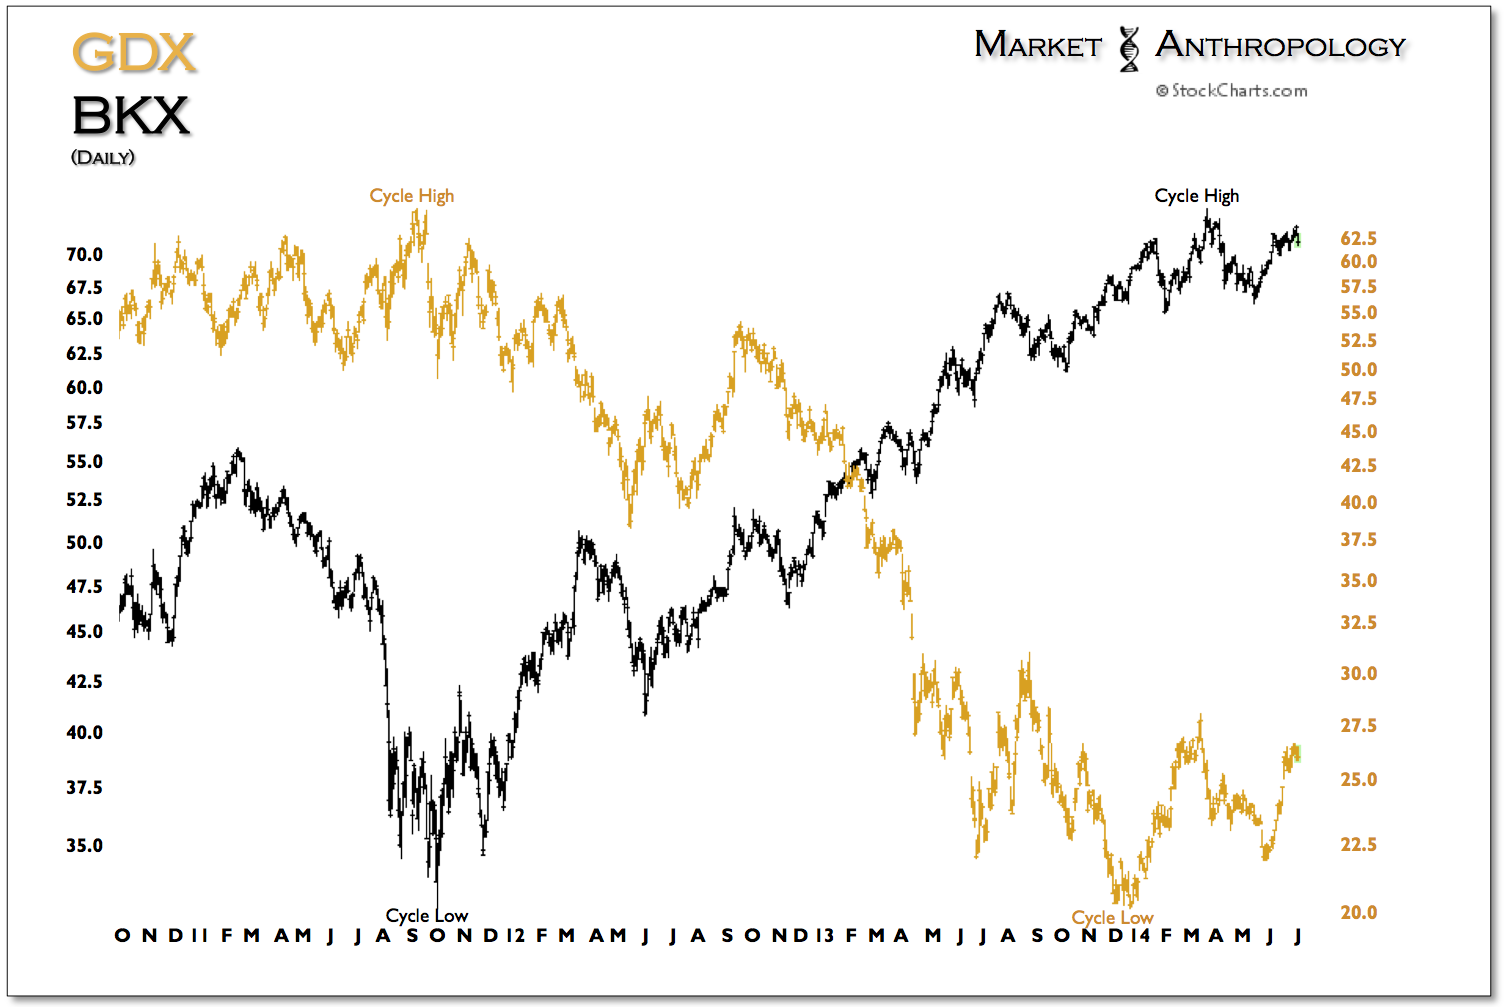
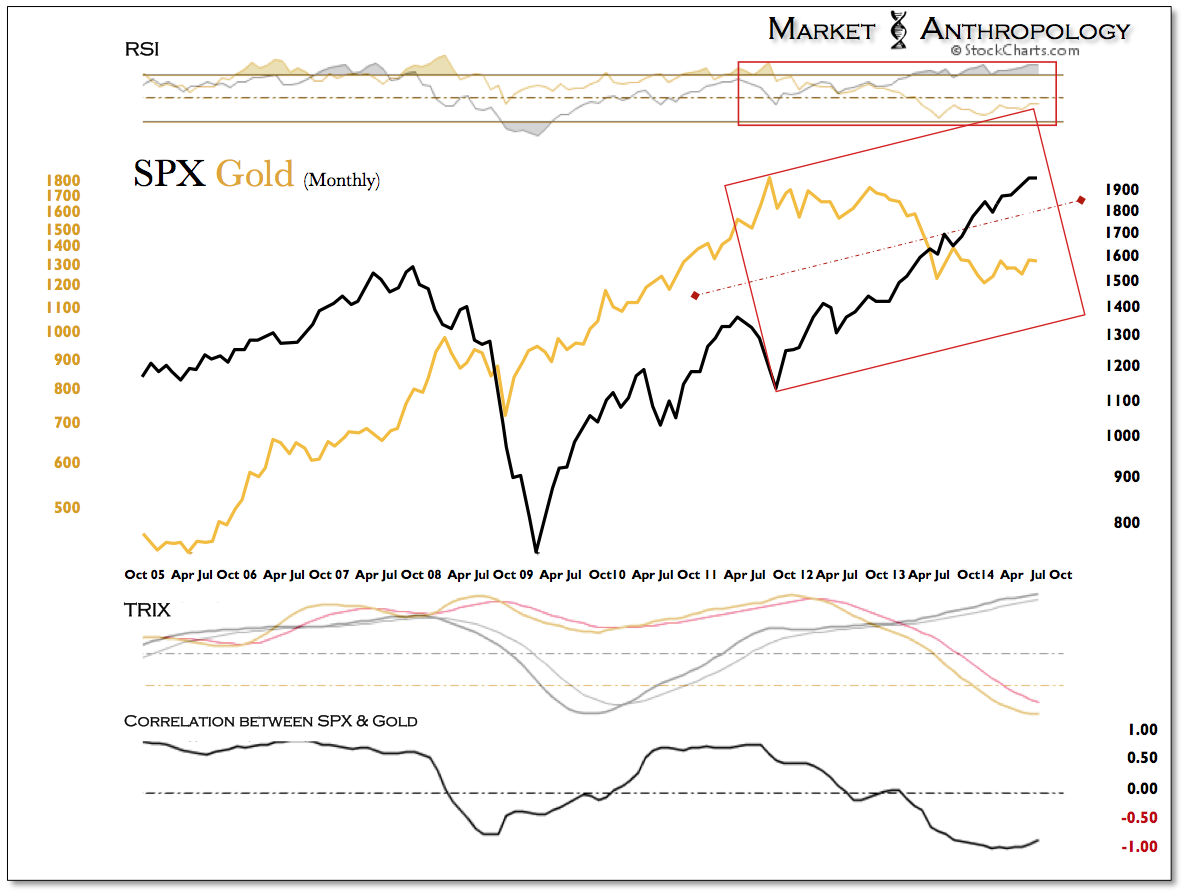
Throughout the year we have followed three risk ratio proxies that have illustrated the staggered start that has developed in the markets as the inflation vane has begun blowing steadily out of the south. Leading the way, the precious metals miners - relative to both spot prices and the S&P 500, made a cyclical low in December of last year and tested those lows coming into June. Similar to the move in silver, the subsequent rally in the miners has been explosive from their respective support zones.
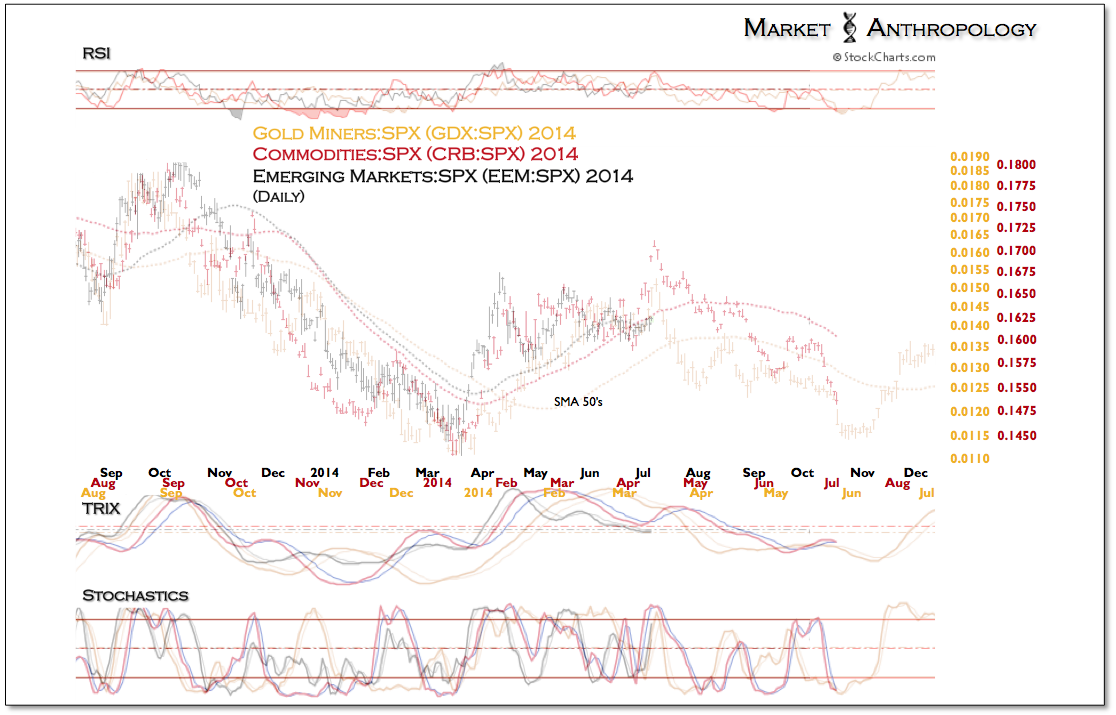
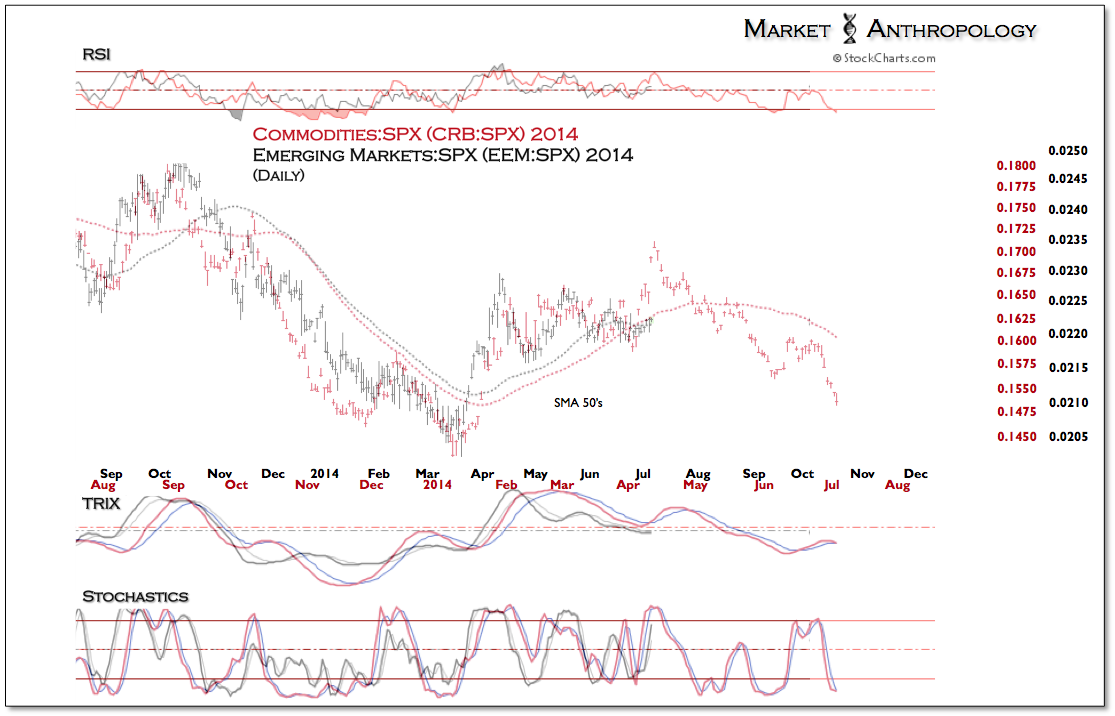
From our perspective - and as shown below in the comparative chart that illustrates the lagged but congruent retracement folds between the miners (Market Vectors Gold Miners (ARCA:GDX)) and the broader commodity sector (relative to the SPX), the CRB has followed the leading path of the miners and appears to be testing the cycle lows from earlier in the year. Our expectations remain that commodities—led by the precious metal sector—will outperform as the third choir of inflationary hymnals finds the chorus of the move.
Lagging even further behind, we will be keeping a keen eye on emerging market equities (iShares MSCI Emerging Markets (ARCA:EEM)) as the ratio roadmap would imply that an intermediate-term high approaches. While we do anticipate that risk appetites will recede in the SPX as the Fed steps further away from an extraordinarily accommodative posture, emerging markets could initially get caught up in the downturn. With that said, and considering our expectations for the US dollar - we will wait to appraise the next leg before making any adjustments to the position.

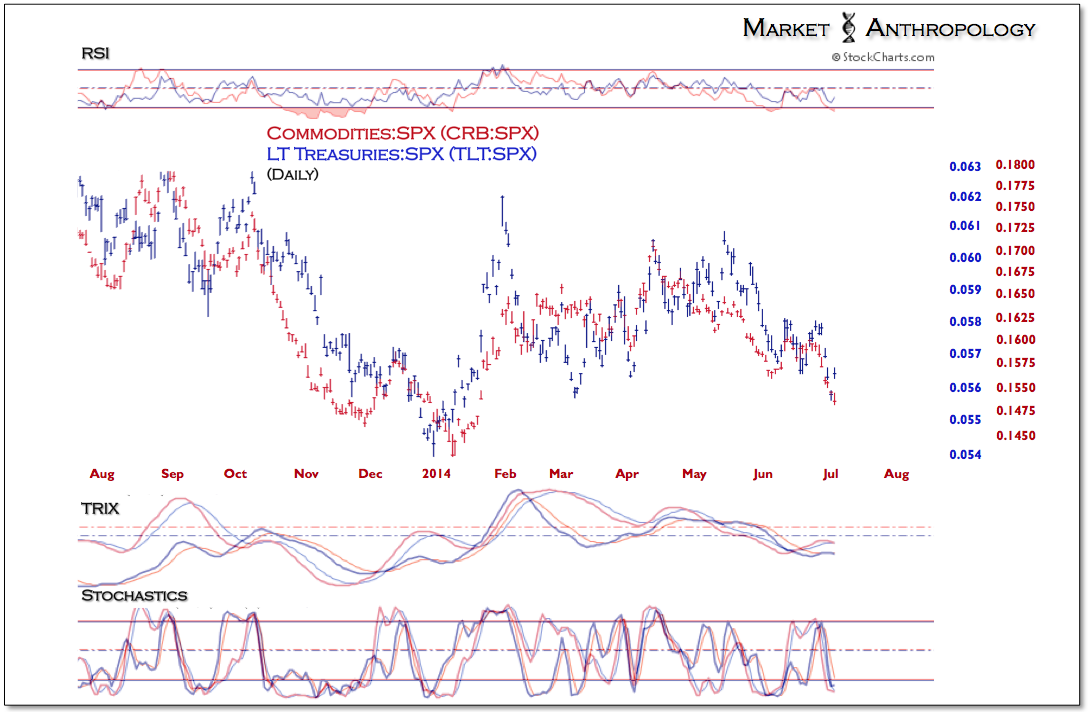
Walking just a few steps in front of the moves in commodities, long-term Treasuries (iShares Barclays 20+ Year Treasury (ARCA:TLT)) appear to have completed their retracement decline. Similar to the miners in June, they have tested and bounced above the lows (relative to the SPX) from earlier in the year.
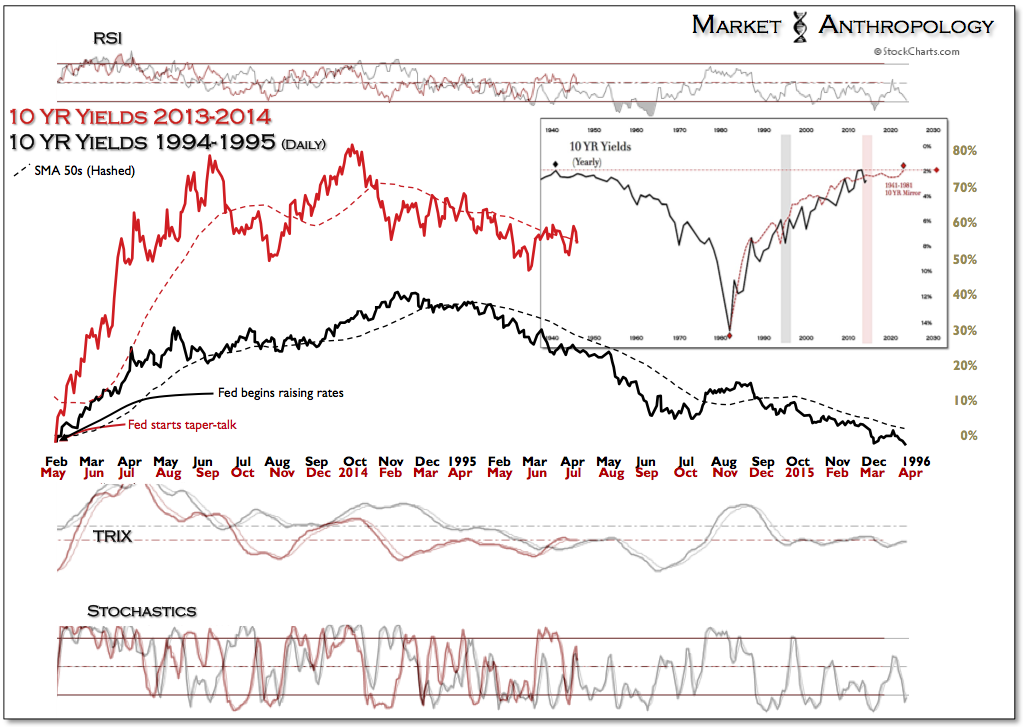
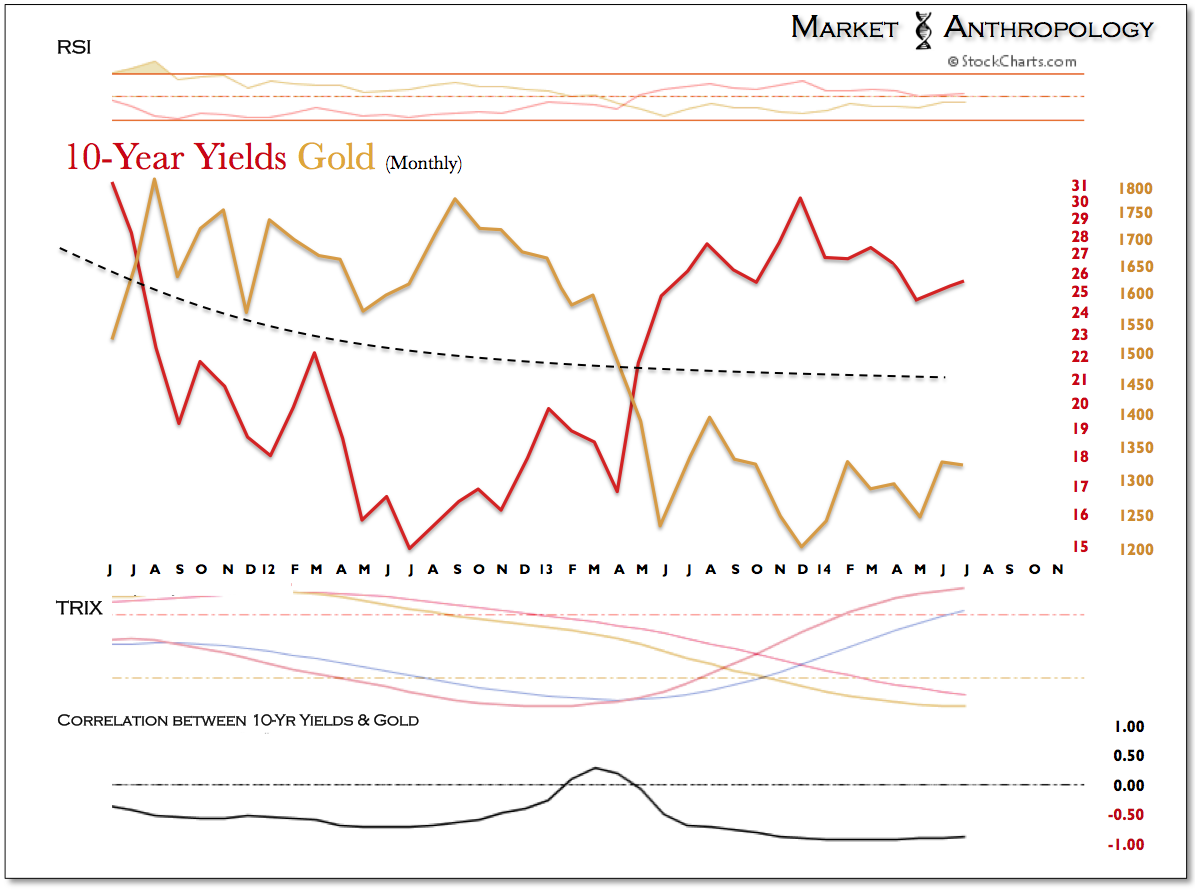
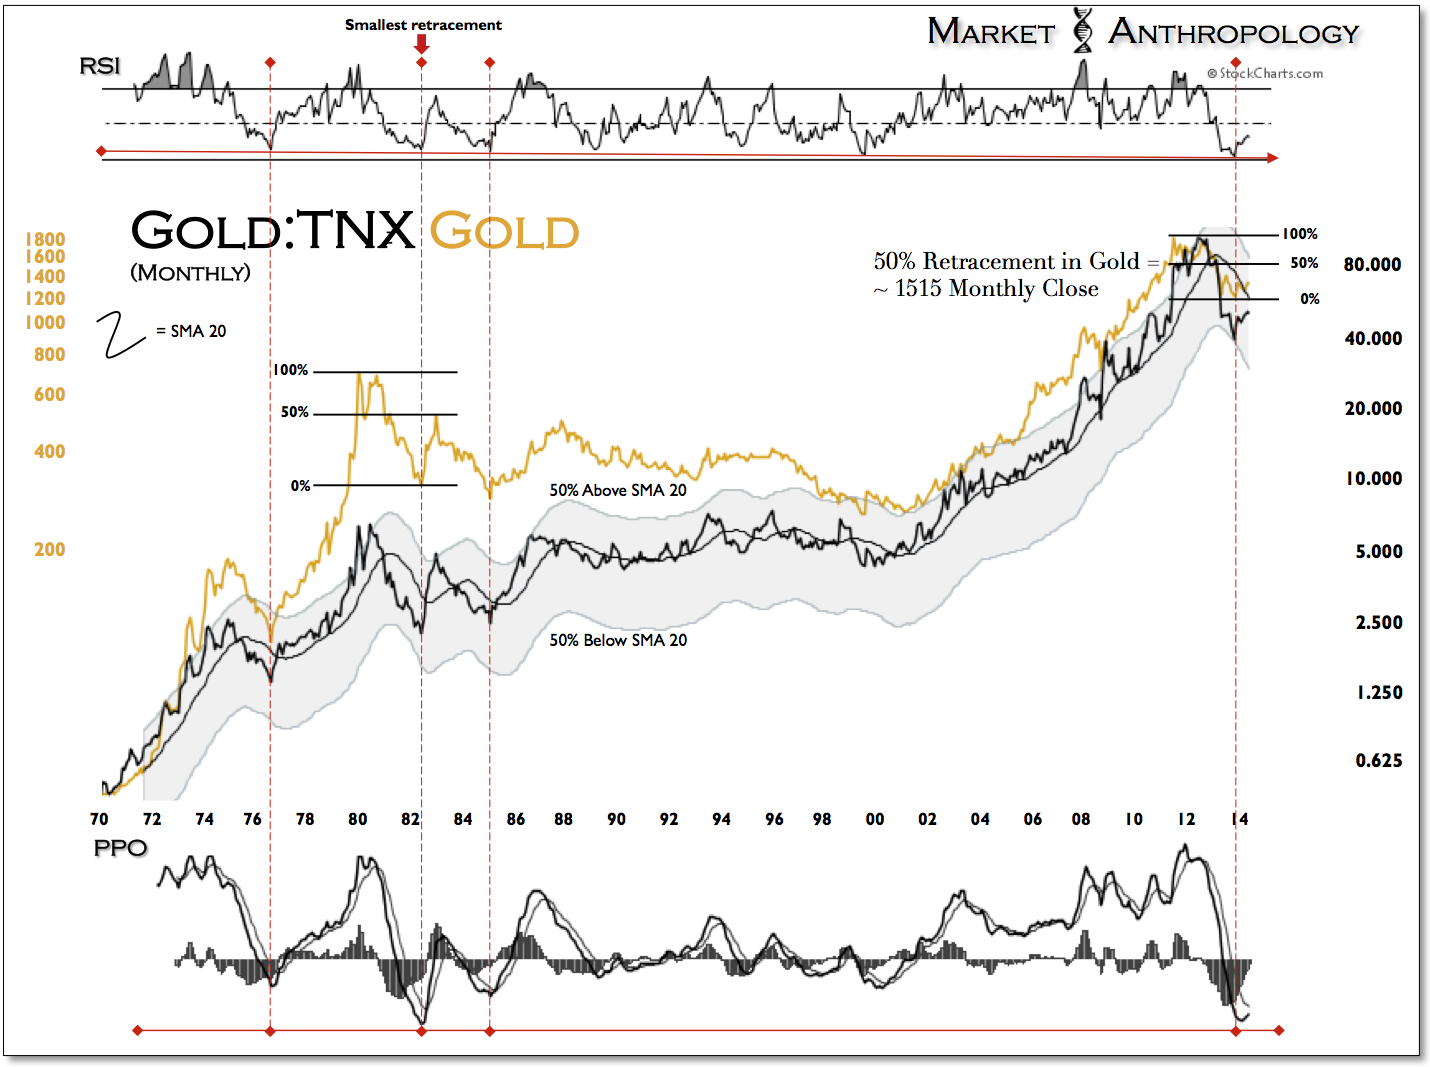
Providing fuel for the fire - despite the trend change in inflation expectations, long-term yields continue to bleed lower against the consensus calls for higher yields and rates.
Although the precious metals sector has strongly outperformed this year, we still consider the moves as part of a broad basing structure that has yet to release the full motivational propellent from both the currency markets and long-term yields. All things considered, those stars appear close to alignment and we remain optimistic of the sector's future potential.


